Key Takeaways
- Source maps, available in the latest stable versions of Chrome, Firefox, and Safari, are a powerful tool for debugging Sass in the browser. They link each line of a CSS file to the corresponding line in its SCSS source file.
- Source maps allow developers to see which Sass partial their CSS originated from, making debugging more efficient. They can also be used in conjunction with Chrome’s Workspaces to edit and save changes directly from the browser.
- To enable source maps in Chrome, developers need to open developer tools, click the gear icon to open Settings, look for the “Sources” section under General, and select “Enable CSS source maps”. The accompanying “Auto-reload generated CSS” should also be enabled.
- Chrome Workspaces can be enabled to allow changes made in the Chrome web inspector to be persisted to the actual files. This feature, along with source maps, allows developers to edit SCSS directly in the browser and instantly see the impact of these changes.
If you use Sass in your front-end projects, chances are your partials are split in a clean and logical fashion based on a reliable Sass architecture.
In such cases, debugging the compiled CSS could be both troublesome and time consuming. Sass provides a flag to enable line numbers (--line-numbers), which includes comments (like below) in your CSS.
/* line 303, molecules\accordions\_accordions.scss */Although this is helpful, you would still have to trace the bug in your CSS back to the source file manually. And editing the CSS in the browser using the developer tools cannot be persisted, since it will get overwritten by the next Sass compile.
So how can we make this process easier?
I’m going to show you how to use source maps in conjunction with Chrome’s Workspaces to allow you to debug and edit Sass from within the browser.
Browser and Sass Requirements
The source maps feature gained a lot of attention when it was first introduced and a lot has changed since. It is now available in the latest stable versions of Chrome, Firefox, and Safari.
You do not require Chrome Canary, nor do you need to edit chrome://flags to use this. You only have to apply the correct settings to enable it.
Source maps require Sass 3.3 or above (Sass 3.4 was released recently).
What is a Source Map?
A source map is a .map file in JSON format that gets generated when your Sass files are compiled into CSS. It contains information that links each line of your CSS file (the output) to the corresponding line in its SCSS source file (the input).
This means when your CSS is compiled, you’ll see a comment like the following at the end of your compiled CSS file:
/*# sourceMappingURL=style.css.map */Below is the content of a truncated .map file.
{
"version": 3,
"mappings": ";AAiIA,qDAAsD;EACpD,OAAO,EAAE,GAAG"
"sources": ["../scss/foundation/components/_breadcrumbs.scss","../scss/foundation/components/_icon-bar.scss","../scss/foundation/components/_offcanvas.scss","../scss/foundation/components/_visibility.scss","../scss/foundation/components/_global.scss","../scss/foundation/pages/_index.scss"],
"names": [],
"file": "foundation.css"
}
How Do Source Maps Help?
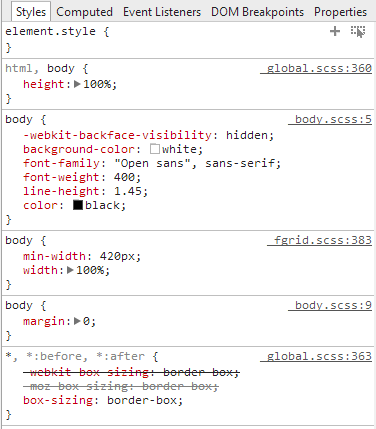
When debugging a web page using Chrome’s developer tools using source maps, the styles panel will show which Sass partial your CSS came from instead of pointing to the CSS file. Meaning, instead of showing the source as style.css, it will show it as _buttons.scss.
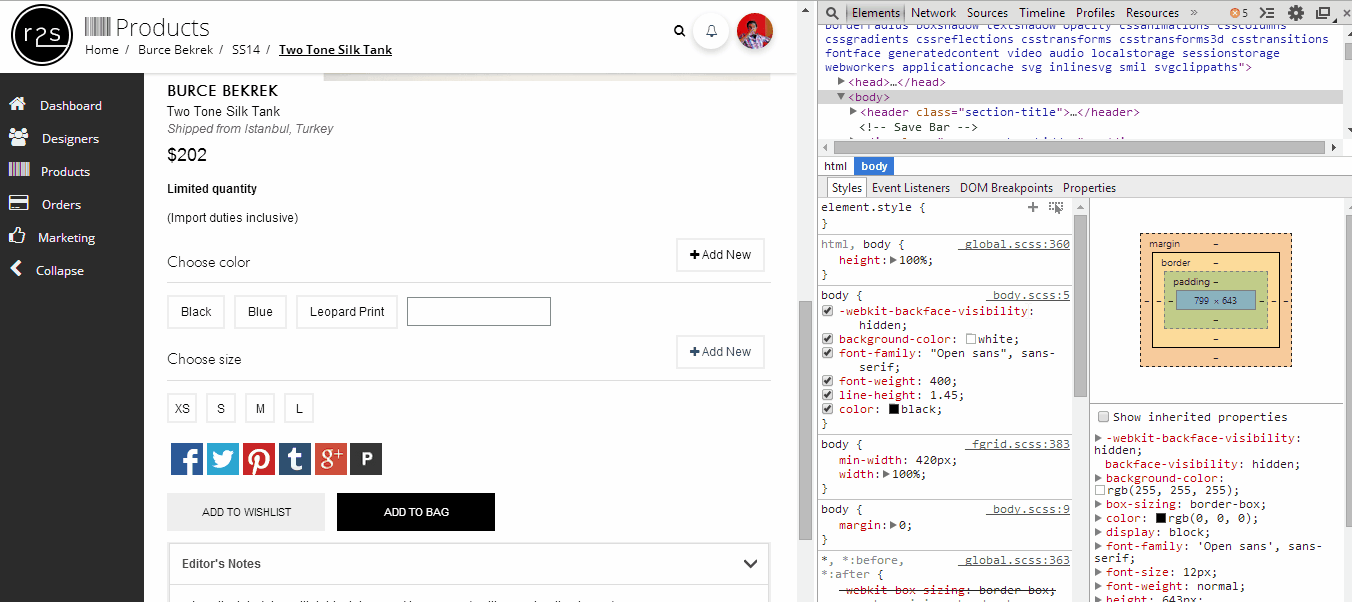
In the example in the screenshot below, the styles for the body element come from a partial called _body.scss.
When inspecting, I would like to know where I have defined the color: black portion in this.
To get this information, I could perform one of the following actions to inspect further:
- Press CTRL and click on the word color. It will open the appropriate partial in the sources tab and place the cursor in the exact line where the style is defined. In this case, the color is defined in a variable called
$black. - Press CTRL and click on the word black. It will open
_colors.scssin the sources tab, where the value for the variable$blackis defined. In case the color black was coming from a mixin instead of a variable, CTRL + clicking on it will open the file where the mixin is defined. Click the image below to view an animated GIF that shows a demonstration of how this might look.
Using source maps with Workspaces allows you to edit and save changes from within Chrome’s developer tools. If sass --watch is running, it will detect the change and recompile the CSS. The browser will then automatically reload this new CSS.
Enabling Source Maps in node-sass Plugins
All the node-sass plugins have APIs to enable the Sass source map option.
-
grunt-contrib-sass – Enable source maps in the
optionssection of your Gruntfile.js to setsourcemap: true. -
gulp-sass
sourceComments: 'map'in gulp-sass will enable source maps in Gulp. This inlines the source maps, meaning they are appended to the end of your CSS file itself. There will be no separate.mapfile in this case. -
broccoli-sass
sourceMap: truewill enable source maps.
Enabling Source Maps Using the Sass Ruby Gem
If you are using the Sass Ruby gem to compile, you can enable source maps with the following terminal command:
sass style.scss:../css/style.css --sourcemapEnabling Source Maps Using Compass
If you are using Compass, you can run the following command:
sass style.scss:../css/style.css --compass --sourcemapOr you can add sass_options = {:sourcemap => true} to your config.rb file and run compass watch as usual.
Enabling Source Maps in Chrome
Enabling source maps will compile a map with references. This compilation will result in two files, a .css file and a .css.map file. The .map file will contain the relevant details to allow you to debug the exact location where a style originates.
To get this working in Chrome, follow the steps below:
- Open developer tools.
- Click the gear icon (top right) to open Settings.
- Under General, look for the “Sources” section. In that section, select “Enable CSS source maps”.
- Make sure the accompanying “Auto-reload generated CSS” is also enabled.
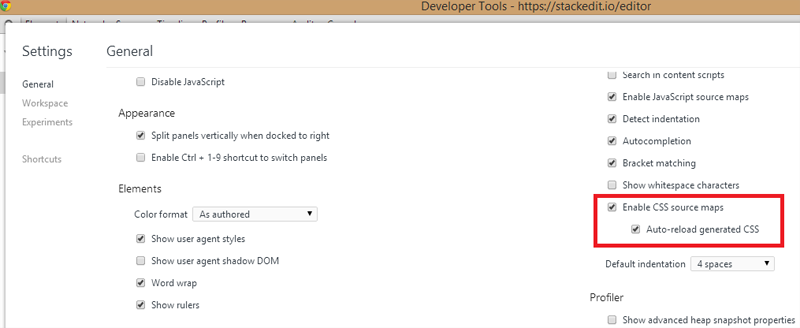
The last step helps to reload the CSS when it changes. Think of it like a live reload feature for the CSS alone.
Note: You will still have to compile the SCSS separately using Grunt, Gulp, sass watch, or compass watch. Once the CSS has been generated this, feature will auto reload it for you.
Live Editing SCSS in the Browser
Enabling Chrome Workspaces will allow you to persist (if you wish) changes that you make to your actual files in the Chrome web inspector. This way you don’t have to try your changes in the browser, see what works, and then head back to your editor to persist these changes.
To enable Workspaces in Chrome, do the following:
- Open Chrome developer tools.
- Click the gear icon to bring up the Settings panel.
- Choose the “Workspace” option on the left side of the Settings panel.
- Select your project’s root folder under the “Folders” section.
- Give Chrome permission to access your local file system.
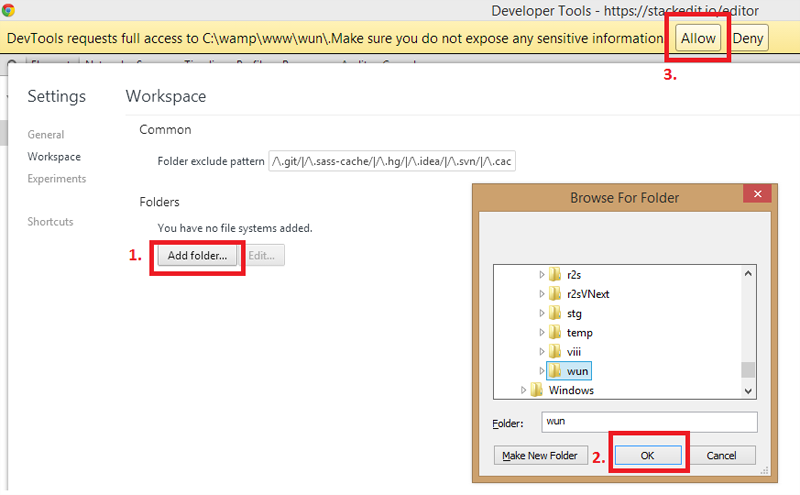
This will add all your project files to the Sources panel in the developer tools.
Mapping from localhost to File on Disk
The last step to editing SCSS in the browser requires you to map the files from localhost to the source files. Doing the following will enable this mapping:
- While viewing the page on your localhost server, inspect any element on your page.
- In the developer tools, choose the Sources tab.
- In the file tree on the left hand side, right-click your stylesheet and select “Map to file system resource…”.
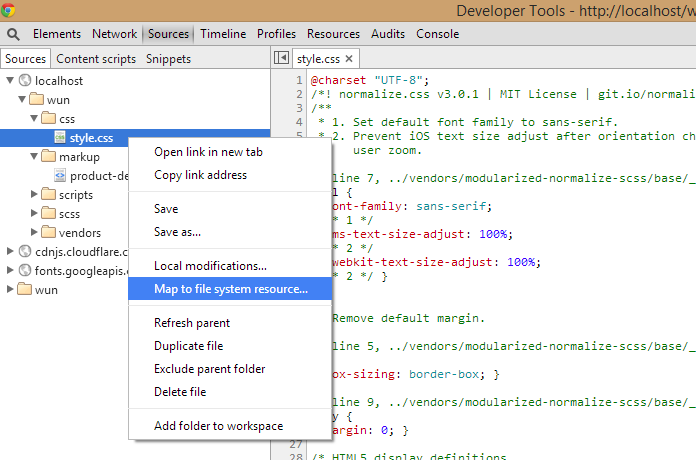
- This will bring up the file search dialog. Select the appropriate file (your stylesheet).
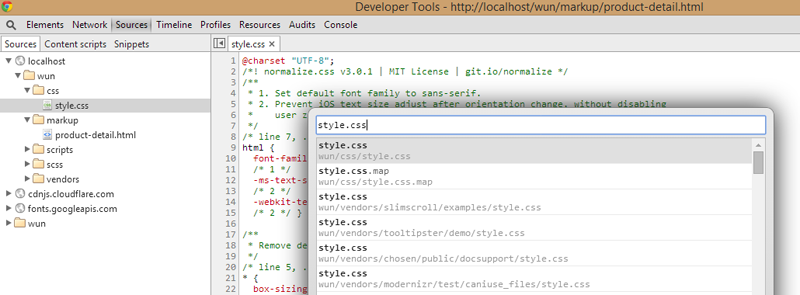
- Restart the developer tools.
This will connect the file from localhost to the files on the actual drive. Now you can edit your SCSS in the browser and when you save, Chrome will write those changes to the actual file.
If you are watching your Sass for changes, the SCSS will get compiled and the CSS will be auto refreshed in your page including your changes.
Conclusion
Source maps enable you to avoid the hassle of switching between editor and developer tools. It enables you to edit the source SCSS directly and allows you to instantly see how these changes look in the browser.
Although this article focused on making source maps work in Chrome, you can do the same in Firefox, and Safari. Internet Explorer 11 also supports source maps, but there doesn’t seem to be any info on using source maps in that browser with Sass, so you’d have to try it for yourself.
If you like to learn visually, check out SassBites #21 by Micah Godbolt, which discusses how to enable and use source maps in Chrome.
I hope this becomes a valuable, time saving addition to your workflow.
Frequently Asked Questions (FAQs) on Using Source Maps to Debug SASS in Chrome
Why am I unable to see my SASS source maps in Chrome DevTools?
There could be several reasons why you’re unable to see your SASS source maps in Chrome DevTools. Firstly, ensure that you have enabled source maps in your DevTools settings. If they are enabled and you still can’t see them, it could be due to the way your project is configured. For instance, if your project is not correctly set up to generate source maps, or if the source map comment at the end of your CSS file is missing or incorrect, you won’t be able to see them in DevTools.
How do I enable source maps in Chrome DevTools?
To enable source maps in Chrome DevTools, open DevTools by right-clicking anywhere on your webpage and selecting ‘Inspect’. Then, click on the gear icon in the top right corner to open settings. Under the ‘Sources’ tab, check the box that says ‘Enable JavaScript source maps’ and ‘Enable CSS source maps’. Once enabled, you should be able to see your source maps in the ‘Sources’ panel.
What are the benefits of using source maps?
Source maps provide a way of mapping code within a compressed file back to its original position in a source file. This is particularly useful when debugging minified CSS or JavaScript, as it allows you to see and debug the original source code instead of the minified version. This can significantly speed up your debugging process and make it much easier to find and fix issues in your code.
Why am I getting a ‘DevTools failed to load SourceMap’ warning in Chrome?
This warning typically appears when DevTools is unable to find a source map file referenced by your code. This could be because the source map file doesn’t exist, or because the path to the source map file in your code is incorrect. To fix this, ensure that your source map files are being correctly generated and that the paths to these files in your code are correct.
How do I generate source maps for my SASS files?
To generate source maps for your SASS files, you need to use a tool that can compile SASS to CSS and generate source maps, such as Node-sass or Dart-sass. When running these tools, you need to include the ‘–source-map’ option in your command. This will generate a source map file alongside your compiled CSS file.
Can I use source maps with other preprocessed languages like LESS?
Yes, source maps can be used with any language that compiles to CSS or JavaScript, including LESS, TypeScript, and CoffeeScript. The process for generating and using source maps with these languages is similar to that for SASS.
Why can’t I see my original SASS code in DevTools?
If you can’t see your original SASS code in DevTools, it’s likely because your source maps are not correctly set up. Ensure that you have enabled source maps in your DevTools settings and that your project is correctly configured to generate source maps.
How do I debug my SASS code using source maps?
To debug your SASS code using source maps, first ensure that source maps are enabled in your DevTools settings and that your project is correctly set up to generate source maps. Then, open DevTools and go to the ‘Sources’ panel. Here, you should be able to see your original SASS files. You can then set breakpoints and step through your code as you would with regular JavaScript or CSS.
Can I use source maps in browsers other than Chrome?
Yes, source maps are supported in all modern browsers, including Firefox, Safari, and Edge. The process for enabling and using source maps may vary slightly between browsers, but the general principles remain the same.
What should I do if my source maps are not working correctly?
If your source maps are not working correctly, first check that they are enabled in your DevTools settings and that your project is correctly set up to generate source maps. If everything seems to be in order but you’re still having issues, it could be due to a bug in your code or a compatibility issue with your browser or tools. In this case, you may need to seek help from a developer community or support forum.
Vinay Raghu is a UI/UX developer passionate about experimenting with the latest frontend technologies. He is an avid open source contributor and loves meetup groups. You can learn more about him at viii.in.