

Raphaël is a small JavaScript library written by Dmitry Baranovskiy of Atlassian, that allows you to create and manipulate vector graphics in your web pages. It’s amazingly simple to use and is cross-browser compatible; supporting Internet Explorer 6.0+, Safari 3.0+, Firefox 3.0+, and Opera 9.5+. Internally Raphaël uses VML in IE and SVG in the other browsers.
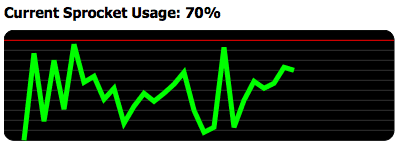
Now, demos involving circles and squares are fine, but I wanted to create an example that demonstrated a legitimate, practical use of vector graphics. So how about real-time statistics measurement? Here’s a screenshot of my Current Sprocket Usage line graph that plots real-time “sprocket” usage levels. Best of all, it was a snap to make.
The HTML is simple; we just need a heading and container to hold our canvas — a div element:
<h1>Current Sprocket Usage: <span id="readout"></span></h1>
<div id="graph"></div>
To start we have to generate a new graphics canvas. I always like to place all my code within an object definition in order to create a separate namespace, so we’ll start with the following code:
var SpGraph = {
  init : function(){
    SpGraph.graph = Raphael("graph", 400, 200);
    SpGraph.graph.rect(0, 0, 390, 110, 10).attr("fill", "#000");
  }
}

window.onload = function () {
  SpGraph.init();
};
Using the window.onload event we call our SpGraph.init method. Within this method we create our canvas using Raphael("graph", 400, 200). The first argument is the ID of our container element, the other two represent width and height. We store the returned canvas object in our SpGraph.graph property. With the next line we create a rectangle and set some attributes:
SpGraph.graph.rect(0, 0, 390, 110, 10).attr("fill", "#000");The rect method allows us to draw a rectangle specifying the x coordinate, y coordinate, width, height, and optionally a corner radius. Notice that we’ve also chained a call to the attr method to set the fill color. All Raphaël graphic objects support the attr method and there’s a range of attributes you can set. Raphaël supports chaining all its methods, which we will take advantage of soon. Our effort so far has resulted in this lovely black rectangle with rounded corners.

Now lets add stripes! To do this we add the following loop to the SpGraph.init method:
for(var x = 10; x < 110; x += 10) {
  var c = (x > 10) ? "#333" : "#f00";
  SpGraph.graph.path({stroke: c}).moveTo(0, x).lineTo(390,x);
}
The loop executes 10 times drawing a line each time; a red line for the first one and a gray line for the others. The Raphaël path method initializes the path mode of drawing, returning a path object. It doesn’t actually draw anything itself; you have to use the path object methods, which are chainable. The moveTo method moves the drawing cursor to the specified x and y coordinates and the lineTo method draws a line from the cursor point to the point specified. The result is the stripey background below:
So now we have to draw the actual graph line. The vertical axis (represented by the stripes) is the percentage usage level. The horizontal axis will represent time in 10 pixel increments. In the real world each update of the graph would be obtained via an Ajax call, say every 5 seconds, but here I just create random values and update the graph every second. Once again, we use the path method to draw a 5 pixel wide line.
We initialise the path and store the reference to it in the SpGraph.path property like so:
SpGraph.path = SpGraph.graph.path({
    stroke: "#0f0",
    "stroke-width": 5,
    "fill-opacity": 0
}).moveTo(20, 110);
Every update, we extend the line using the lineTo method like so:
SpGraph.path.lineTo(20+SpGraph.updates*10, 110-perf);perfis a random value between 0 and 100. TheSpGraph.updatesproperty is a simple counter that allows us to control how many updates before the line is reset. The counter value is also used to plot the location of the line on the horizontal axis. After 35 updates the line is reset by removing it, using theSpGraph.path.removemethod, and starting a new one.So the whole script looks like this:
var SpGraph = {
  init : function(){
    SpGraph.graph = Raphael("graph", 400, 200);
    SpGraph.graph.rect(0, 0, 390, 110, 10).attr("fill", "#000");

    for(var x = 10; x < 110; x += 10) {
      var c = (x > 10) ? "#333" : "#f00";
      SpGraph.graph.path({stroke: c}).moveTo(0, x).lineTo(390,x);
    }
    SpGraph.startPath();
    SpGraph.updateGraph();
  },
  startPath : function() {
    if(SpGraph.path) {
      SpGraph.path.remove();
    }
    SpGraph.path = SpGraph.graph.path({
        stroke: "#0f0",
        "stroke-width": 5,
        "fill-opacity": 0
    }).moveTo(20, 110);
  },
  updateGraph : function() {
    if(SpGraph.updates++ < 36) {
      // imagine this value comes from an ajax request
      var perf = Math.floor(Math.random() * 100);
      SpGraph.path.lineTo(20+SpGraph.updates*10, 110-perf);
      document.getElementById('readout').innerHTML = perf+'%';
    } else {
      SpGraph.updates = 0;
      SpGraph.startPath();
    }
    SpGraph.timer = setTimeout("SpGraph.updateGraph();",1000);
  },
  updates : 0
}
window.onload = function () {
  SpGraph.init();
};
Don’t forget to see it working in the demo. OK, so maybe a sprocket usage graph isn’t exactly the legitimate, practical example I promised, but at least you got a look at what you can achieve with Raphaël with only a little effort. The documentation on the site isn’t complete, but it’s not too difficult to work out anyway. Why don’t you have a go yourself? Quick, Simple, cross-browser compatible, vector graphics on the web has never been easier.
Frequently Asked Questions about Easy Vector Graphics with the Raphael JavaScript Library
What is the Raphael JavaScript Library?
The Raphael JavaScript Library is a powerful tool that allows developers to work with vector graphics on the web. It simplifies the process of creating, manipulating, and animating vector graphics, making it an excellent choice for developers who want to add visually appealing elements to their websites or web applications. The library is cross-browser compatible and uses the SVG W3C Recommendation and VML as a base for creating graphics, which means it can work in virtually any browser.
How do I get started with the Raphael JavaScript Library?
To get started with the Raphael JavaScript Library, you first need to include the library in your HTML file. You can do this by downloading the library from the official website and linking it in your HTML file. Once the library is included, you can start creating vector graphics by calling the Raphael function and specifying the width and height of the paper object where your graphics will be drawn.
Can I animate vector graphics with the Raphael JavaScript Library?
Yes, one of the key features of the Raphael JavaScript Library is its ability to animate vector graphics. The library provides several methods for animation, including the animate method, which allows you to animate the transformation of an object over a specified duration. You can also control the easing of the animation and specify a callback function to be executed when the animation is complete.
How do I create shapes with the Raphael JavaScript Library?
The Raphael JavaScript Library provides several methods for creating shapes. For example, you can use the rect method to create a rectangle, the circle method to create a circle, and the ellipse method to create an ellipse. Each method requires specific parameters, such as the coordinates of the top-left corner and the width and height for the rect method, or the center coordinates and radius for the circle method.
How do I apply styles to shapes in the Raphael JavaScript Library?
You can apply styles to shapes in the Raphael JavaScript Library using the attr method. This method allows you to set various attributes of a shape, such as its fill color, stroke color, stroke width, and opacity. You can also use the attr method to apply transformations to a shape, such as scaling, rotation, and translation.
Can I interact with shapes in the Raphael JavaScript Library?
Yes, the Raphael JavaScript Library provides several methods for interacting with shapes. For example, you can use the click method to attach a click event handler to a shape, or the hover method to attach mouseover and mouseout event handlers. These methods allow you to create interactive graphics that respond to user actions.
How do I group shapes in the Raphael JavaScript Library?
You can group shapes in the Raphael JavaScript Library using the set method. This method creates a set of shapes that can be manipulated as a single unit. You can add shapes to a set using the push method, and apply transformations or animations to all shapes in the set at once.
Can I use the Raphael JavaScript Library to create complex graphics?
Yes, the Raphael JavaScript Library is capable of creating complex graphics. In addition to basic shapes, the library provides methods for creating paths, which can be used to create complex shapes and designs. You can also combine multiple shapes and paths to create intricate graphics.
How do I export graphics created with the Raphael JavaScript Library?
Graphics created with the Raphael JavaScript Library are rendered in the browser and can be exported as SVG or VML, depending on the browser. You can access the SVG or VML source code of a graphic by calling the toString method on the paper object. This method returns a string of SVG or VML code that represents the current state of the paper.
Where can I find more resources on the Raphael JavaScript Library?
For more resources on the Raphael JavaScript Library, you can visit the official website, which provides a comprehensive documentation of the library. You can also check out various online tutorials and blog posts that provide step-by-step guides on how to use the library. Additionally, you can find numerous examples and demos on code sharing platforms like GitHub and CodePen.

