This article was originally published on the 99designs Tech Blog
At 99designs we heavily (ab)use Varnish to make our app super fast, but also to do common, simple tasks without having to invoke our heavy-by-contrast PHP stack. As a result, our Varnish config is pretty involved, containing more than 1000 lines of VCL, and a non-trivial amount of embedded C.
When we started seeing regular segfaults, it was a pretty safe assumption that one of us had goofed writing C code. So how do you track down a transient segfault in a system like Varnish? Join us down the rabbit hole…
Key Takeaways
- Debugging Varnish, a powerful HTTP engine/reverse HTTP proxy, involves modifying the production environment to provide useful core dumps, and locating the crash point using tools such as LLDB from the LLVM project.
- The article provides a detailed guide on how to analyze a core dump and locate the crash point, using tools such as Voltron and gdb, and understanding the assembly code.
- If debugging points towards a potential issue with the memory allocation library, it may be possible to rule this out by swapping in another malloc library implementation using LD_PRELOAD. However, this may not be possible with older versions of Varnish.
- If the issue persists, it may be necessary to rebuild Varnish, by grabbing a copy of the Varnish source, linking it against another malloc library, and making necessary changes to the configure script and makefiles.
Get a core dump
The first step is to modify your production environment to provide you with useful core dumps. There are a few steps in this:
-
First of all, configure the kernel to provide core dumps by setting a few sysctls:
echo 1 > /proc/sys/kernel/core_uses_pid
echo 2 > /proc/sys/fs/suid_dumpable
mkdir /mnt/cores
chmod 777 /mnt/cores
echo  /mnt/cores/core > /proc/sys/kernel/core_pattern
In order, this:
- Tells the kernel to append pid’s to core files to make it easy to marry up the cores with the logs
- Tells the kernel that suid binaries are allowed to dump core
- Creates a place to store cores on AWS’s ephemeral storage (if like us you’re on EC2)
- Tells the kernel to write core files out there
-
With this done, and no known way to trigger the bug, play the waiting game.
-
When varnish explodes, it’s show time. Copy the core file, along with the shared object that varnish emits from compiling the VCL (Located in
/var/lib/varnish/$HOSTNAME) over to a development instance and let the debugging begin.
Locate the crash point
If you have access to the excellent LLDB from the LLVM project, use that. In our case, getting it to work on Ubuntu 12.04 involves upgrading half the system, resulting in an environment too dissimilar to production.
If you spend a lot of time in a debugger, you’ll probably want to use a helper like fG!’s gdbinit or voltron to make your life easier. I use voltron, but because of some of the clumsiness in gdb’s API, immediately ran into some bugs.
Finally, debugging environment working, it’s time to dig into the crash. Your situation is going to be different to ours, but here’s how we went about debugging a problem like this recently:
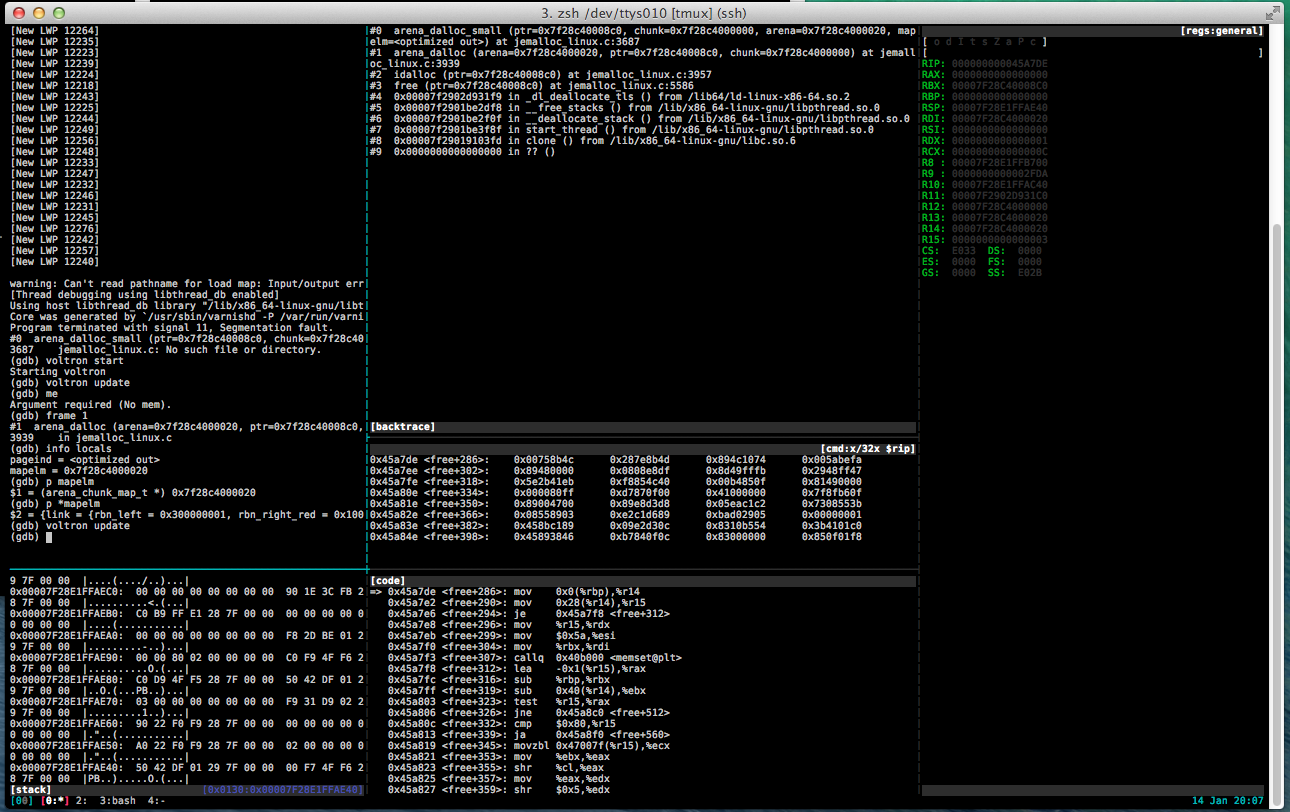
Debugging the core dump with voltron
As you can see in the code pane, the faulting instruction is mov 0x0(%rbp),%r14, trying to load the value pointed to by RBP into r14. Looking in the register view we see that RBP is NULL.
Inspecting the source, we see that the faulting routine is inlined, and that the compiler has hijacked RBP (The base pointer for the current stack frame) to use as argument storage for the inline routine
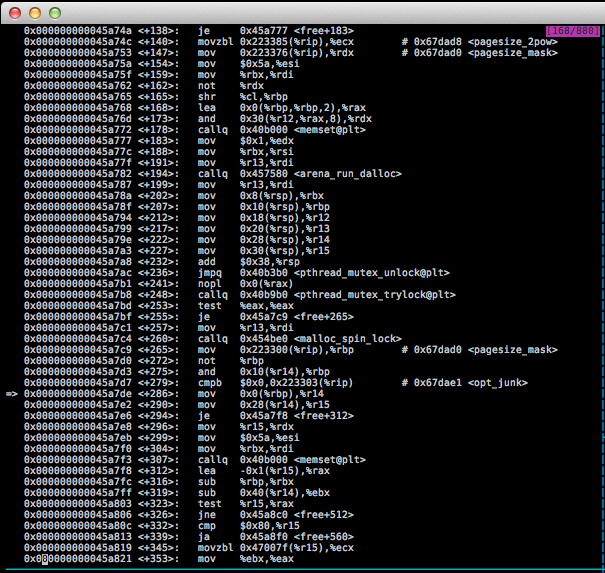
The offending assembly code
Of specific interest is this portion:
   0x000000000045a7c9 <+265>:   mov    0x223300(%rip),%rbp        # 0x67dad0 <pagesize_mask>
   0x000000000045a7d0 <+272>:   not    %rbp
   0x000000000045a7d3 <+275>:   and    0x10(%r14),%rbp
   0x000000000045a7d7 <+279>:   cmpb   $0x0,0x223303(%rip)        # 0x67dae1 <opt_junk>
=> 0x000000000045a7de <+286>:   mov    0x0(%rbp),%r14
   0x000000000045a7e2 <+290>:   mov    0x28(%r14),%r15
Which in plain english:
- Loads a
riprelative address intorbp(pagesize_mask) - Inverts
rbpbitwise - Performs a bitwise and against 16 bytes into the structure pointed to by
r14, (mapelm->bits) - Pointlessly checks if pagesize_mask is
NULL - Tries to load the address pointed to by
rbpintor14, which faults.
Which is emitted by:
static inline void
arena_dalloc_small(arena_t *arena, arena_chunk_t *chunk, void *ptr,
    arena_chunk_map_t *mapelm)
{
    arena_run_t *run;
    arena_bin_t *bin;
    size_t size;
    run = (arena_run_t *)(mapelm->bits & ~pagesize_mask);
    assert(run->magic == ARENA_RUN_MAGIC);
    bin = run->bin; // XXX KABOOM
    size = bin->reg_size;
We now know that the fault is caused by a mapelm struct with a bits member
set to zero; but why are we getting passed this broken struct with garbage in
it?
Digging in deeper
Since this function is declared inline, it’s actually folded into the calling frame. The only reason it actually appears as in the backtrace is because the callsite is present in the DWARF debugging data.
We can poke at the value by inferring its location from the upstream assembly, but it’s easier to jump into the next upstream frame and inspect that:
(gdb) frame 1

#1  arena_dalloc (arena=0x7f28c4000020, ptr=0x7f28c40008c0, chunk=0x7f28c4000000) at jemalloc_linux.c:3939

3939    in jemalloc_linux.c

(gdb) info locals

pageind = <optimized out>

mapelm = 0x7f28c4000020

(gdb) p *mapelm

$3 = {link = {rbn_left = 0x300000001, rbn_right_red = 0x100002fda}, bits = 0}

(gdb)
So this looks like an element in a red black tree, with two neighours and a null for the bits member. Let’s double check:
(gdb) ptype *mapelm
type = struct arena_chunk_map_s {
    struct {
        arena_chunk_map_t *rbn_left;
        arena_chunk_map_t *rbn_right_red;
    } link;
    size_t bits;
}
(gdb) ptype arena_run_t
type = struct arena_run_s {
    arena_bin_t *bin;
    unsigned int regs_minelm;
    unsigned int nfree;
    unsigned int regs_mask[1];
}
(gdb)
Wait, what?
Looking back to get our bearings:
run = (arena_run_t *)(mapelm->bits & ~pagesize_mask);The code is trying to generate a pointer to this arena run structure, using the number of bits in the mapelm struct, AND against the inverse pagesize_mask to locate the start of a page. Because bits is zero, this is the start of the zero page; a NULL pointer.
This is enough to see how it’s crashing, but doesn’t give us much insight for why. Let’s go digging.
Looking back at the code snippet, we see an assertion that the arena_run_t structure’s magic member is correct, so with that known we can go looking for other structures in memory. A quick grep turns up:
./lib/libjemalloc/malloc.c:# define ARENA_RUN_MAGIC 0x384adf93
pagesize_mask is just the page size -1, meaning that any address bitwise AND against the inverse of the pagesize_mask will give you the address at the beginning of that page.
We can therefore just search every writable page in memory for the magic number at the correct offset.
.. Or can we?
typedef struct arena_run_s arena_run_t;
struct arena_run_s {
#ifdef MALLOC_DEBUG
    uint32_t    magic;
#  define ARENA_RUN_MAGIC 0x384adf93
#endif
    /* Bin this run is associated with. */
    arena_bin_t *bin;
...
The magic number and magic member of the struct (Conveniently located as the first 4 bytes of each page) only exists if we’ve got a debug build.
Aside: can we abuse LD_PRELOAD for profit?
At this point all signs point to either a double free in varnish’s thread pool implementation, leading to an empty bucket (bits == 0), or a bug in its memory allocation library jemalloc.
In theory, it should be pretty easy to rule out jemalloc, by swapping in another malloc library implementation. We could do that by putting, say tcmalloc, in front of its symbol resolution path using LD_PRELOAD:
We’ll add:
export LD_PRELOAD=/usr/lib/libtcmalloc_minimal.so.0
to /etc/varnish/default and bounce varnish. Then move all the old core files out of the way, wait (and benchmark!)
However, there’s a flaw in our plan. Older versions of varnish (remember that we’re on an LTS distribution of Ubuntu) vendor in a copy of jemalloc and statically link it, meaning that the symbols free and malloc are resolved at compile time, not runtime. This means no easy preload hacks for us.
Rebuilding Varnish
The easy solution won’t work, so let’s do the awkward one: rebuild varnish!
apt-get source varnish
Grab a copy of the varnish source, and link it against tcmalloc. Before that though, I deleted lib/libjemalloc and used grep to remove every reference to jemalloc from the codebase (Which was basically just some changes to the configure script and makefiles)
and then add -ltcmalloc_minimal to CFLAGS before building. As an aside, the ubuntu packages for tcmalloc ship /usr/lib/libtcmalloc_minimal.so.0 but not /usr/lib/libtcmalloc_minimal.so, which means the linker can’t find them. I had to manually create a symlink.
With this new varnish in production, we haven’t yet seen the same crash, so it appears that it was a bug in jemalloc, probably a nasty interaction between libpthread and libjemalloc (The crash was consistently inside thread initialization).
Try it yourself?
Let’s hope not. But if you do a lot of Varnish hacking with custom extensions, occasional C bugs are to be expected. This post walked you through a tricky Varnish bug, giving you an idea of the tools and tricks around debugging similar hairy segfaults.
If you’re messing around with voltron, you might find my voltron config and the tmux script I use to setup my environment a useful starting point.
Frequently Asked Questions about Debugging Varnish
What is Varnish and why is it important for my website?
Varnish is a powerful, open-source HTTP engine/reverse HTTP proxy that can speed up a website by up to 300-1000 times, depending on the website’s architecture. It works by storing a copy of the page served by the web server the first time a user visits that page. For subsequent requests, Varnish will serve the cached copy instead of requesting the page from the web server, thus reducing response time and server load.
How can I install Varnish on my server?
Varnish can be installed on your server using package managers like apt for Debian-based systems or yum for RHEL-based systems. The exact command will depend on your server’s operating system. For example, on a Debian-based system like Ubuntu, you would use the command sudo apt-get install varnish.
How can I start debugging Varnish?
Debugging Varnish involves using the varnishlog tool. This tool provides a detailed log of all requests and responses, including client requests, backend requests, and cache hits and misses. To start debugging, you would run the command varnishlog.
What are some common issues I might encounter with Varnish?
Some common issues include cache misses, where Varnish is not caching content as expected, and backend fetch failures, where Varnish is unable to fetch content from the backend server. These issues can often be diagnosed using the varnishlog tool.
How can I interpret the output of varnishlog?
The output of varnishlog can be quite verbose, but it is structured in a way that makes it easier to understand. Each log entry consists of a log ID, a log tag, and a log value. The log ID is used to group related log entries together. The log tag indicates the type of event, such as a client request or a backend response. The log value provides more detailed information about the event.
How can I control what information is logged by varnishlog?
You can control what information is logged by varnishlog using command-line options. For example, the -i option allows you to specify which log tags to include, while the -x option allows you to specify which log tags to exclude.
How can I test my Varnish configuration file?
You can test your Varnish configuration file using the varnishd -C -f /path/to/your/vcl/file command. This will check the syntax of your configuration file and report any errors.
How can I monitor the performance of Varnish?
You can monitor the performance of Varnish using the varnishstat tool. This tool provides real-time statistics about cache hits and misses, backend connections, and other performance metrics.
How can I tune the performance of Varnish?
You can tune the performance of Varnish by adjusting various parameters in your Varnish configuration file. These parameters control things like the size of the cache, the maximum number of backend connections, and the algorithm used for cache eviction.
Where can I find more resources to help me with Varnish?
The official Varnish website provides a wealth of resources, including documentation, tutorials, and a community forum. There are also many blog posts, videos, and online courses available from various sources on the internet.