

Web development for mobile devices has several major limitations.
There are strongly divergent screen resolutions (from iPad to the first generation of Blackberry), multiple browsers (webkit but also IEMobile, Firefox, Opera mini and mobile, etc.) and multiple operating systems (Windows Phone, Android, iOS, Palm, Blackberry). Each device has its own constraints and performance.
When it comes time to debug all this, the task is not easy because there are only few tools permitting it – and because of the size of the screen, even then we are not out of the woods.
Dragonfly for Opera already offers a native solution for remote debugging, but this technique is quite limited, especially when one has to take into account other mobile / browsers. Several phone manufacturers also offer emulators, but they don’t compare to the use of a real device offering “feel and touch” – especially on the side of the web-client programming, and especially JavaScript.
It is to help us in this perilous task that jsconsole was created.
A JavaScript Console for Mobile
Go to the following address: http://jsconsole.com.
Jsconsole will allow you to debug a JavaScript application remotely through a console located on your desktop, which will be used to debug directly on your phone. To make an analogy, it is as if you were using the Firebug JS console remotely.
On the one hand, the tool will retrieve every call to console.log from your mobile and will display it on your desktop.
On the other hand, jsconsole will allow you to inject JavaScript code directly into your pages.
Understand that this tool is normally used only in the development phase or debugging and should always be removed prior to the production start of your website.
Initialize jsconsole
The first step is to create the link between your site and jsconsole. To do this, enter the first command in the console:
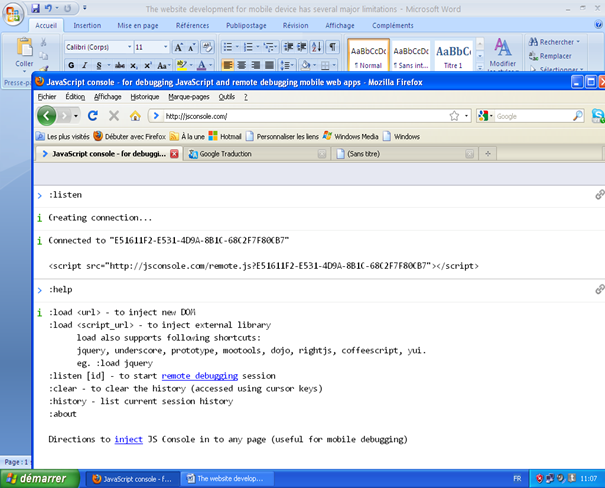
:listen
This command will return an identifier and a tag <script> to integrate to your website. The code you receive will look like this:
Now you just have to add this line to the desired location in your HTML code (in the head, for example).
If you end up using this tool frequently to avoid having to change the tag <script> for each test, you can reuse the same identifier by specifying the following command:
:listen FAE031CD-74A0-46D3-AE36-757BAB262BEA
Similarly, you can also specify the identifier you want to use. For example:
:listen party
That goes along with this <script>:
<script src="http://jsconsole.com/remote.js?party"> </ script>
Once this code is inserted on your site, you can test the connection with a single line in your web page, for example:
<script type="text/javascript">

console.log ("Connection");

</ script>
Then log on to your site using your mobile and make sure that you have received notification in the console on your desktop.
Send directives from jsconsole
Once the connection is established correctly, you can send any line of JavaScript code on your mobile. To do this, you can simply type the line of code to run directly into the console.
For example:
document.innerHTML = "Hello World !";
You can also use your regular libraries, for example with jQuery installed on your site, you could send this piece of code:
$ ("# myElement") fadeOut ();
Conclusion
That’s an overview of a tool that is more than necessary when we program for mobile devices, and especially when we use the functions that are linked to them. Jsconsole also has other interesting features that are less important. For this, I invite you to read the documentation the jsconsole site.
Frequently Asked Questions about Debugging Mobile with JSConsole
What is JSConsole and how does it work?
JSConsole is a powerful tool that allows developers to debug JavaScript code on mobile devices. It works by creating a remote console that you can interact with from your desktop. You simply enter your JavaScript code into the console, and it will be executed on your mobile device. This allows you to test and debug your code in the actual environment it will be running in, which can help you catch and fix issues that might not show up in a desktop browser.
How do I start using JSConsole for mobile debugging?
To start using JSConsole, you need to visit the JSConsole website and click on the “Start debugging” button. This will generate a unique URL that you can open on your mobile device. Once you’ve done that, you can start entering JavaScript code into the console on your desktop, and it will be executed on your mobile device.
Can I use JSConsole to debug code on multiple devices at once?
Yes, you can use JSConsole to debug code on multiple devices simultaneously. Each device will need to open the unique URL generated by JSConsole. This can be particularly useful when you’re trying to debug issues that only occur on certain devices or under certain conditions.
What kind of issues can I debug with JSConsole?
JSConsole allows you to debug a wide range of issues, from simple JavaScript errors to more complex issues involving AJAX requests or the Document Object Model (DOM). You can also use it to test and debug responsive design issues, as it allows you to see how your code behaves on different devices and screen sizes.
How do I view the output of my code in JSConsole?
The output of your code will be displayed in the console on your desktop. This includes any console.log statements, as well as any errors or exceptions that are thrown by your code. You can also use the console to interact with your code, for example by calling functions or inspecting variables.
Can I use JSConsole to debug code that’s already running on my website?
Yes, you can use JSConsole to debug code that’s already running on your website. You simply need to include a special script tag in your HTML code, which will connect your website to the JSConsole service. Once you’ve done that, you can interact with your website’s JavaScript code from the console on your desktop.
Is JSConsole free to use?
Yes, JSConsole is completely free to use. It’s an open-source project, which means you can also contribute to its development if you wish.
Can I use JSConsole offline?
No, JSConsole requires an internet connection to work. This is because it works by creating a remote console that communicates with your mobile device over the internet.
Does JSConsole support all mobile devices?
JSConsole should work with any device that has a modern web browser. However, the exact features and capabilities may vary depending on the specific browser and device you’re using.
Can I use JSConsole to debug other types of code, like HTML or CSS?
While JSConsole is primarily designed for debugging JavaScript code, you can also use it to debug HTML and CSS issues. For example, you can use it to inspect the DOM, modify CSS styles, or even execute jQuery commands.

