- Adobe tools:
- Contents:
- Step 1: Create the background graphic in Illustrator CC 2014
- Step 2: Build the static composition in Edge Animate
- Step 3: Build the TimelineTrigger widget
- Step 4: Build the DetailPanel widget
- Step 5: Add a data source
- Step 6: Bind the triggers to the detail panel
- Where to go from here
- Frequently Asked Questions (FAQs) about Creating Infographics with Adobe Edge Animate CC 2014
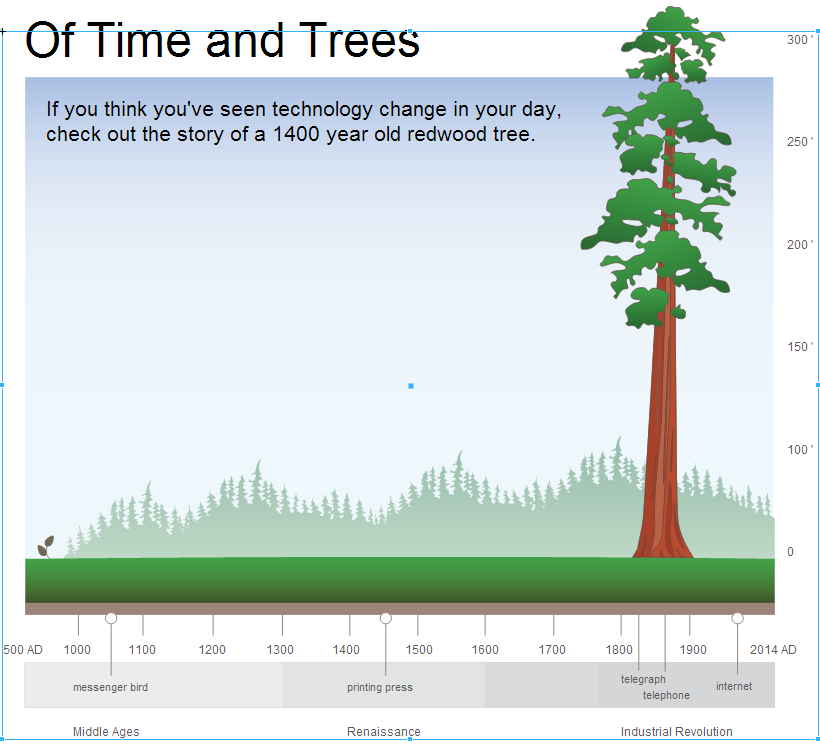
This tutorial guides you through building an interactive infographic in Adobe Edge Animate CC 2014 (see Figure 1). Along the way, you’ll learn how to bring your design to life with interactive widgets containing animated states. If you’re interested in infographic design, you might like to read this tutorial’s companion piece!
See the Pen Adobe Edge – Of Time and Trees Demo by SitePoint (@SitePoint) on CodePen.
Adobe tools:
This tutorial covers a simple workflow using:
• Adobe Illustrator CC 2014
• Adobe Edge Animate CC 2014
Contents:
This tutorial walks through creating an infographic composition, from start to finish:
- Step 1: Create the background graphic in Illustrator CC 2014
- Step 2: Build the static composition in Edge Animate CC 2014
- Step 3: Build the TimelineTrigger widget
- Step 4: Build the DetailPanel widget
- Step 5: Add a data source
- Step 6: Bind the triggers to the detail panel
Step 1: Create the background graphic in Illustrator CC 2014
The tutorial assumes that you’ve already done the important work of collecting data, text, and a story or message for your infographic. When you’re ready to move from concept to design, Adobe Photoshop CC 2014 or Adobe Illustrator CC 2014 is a good place to start.
In this case, you’ll produce the background graphic in Illustrator. Later, you’ll convert the vector graphics to SVG (Scalable Vector Graphics) format by copying and pasting them in Edge Animate CC 2014. As the name would suggest, SVG files are scalable, and will work well with the responsive layout you’ll build in Edge Animate.
Follow these steps to create the background graphic:
1. Setup the project.
a. Download and install Adobe Illustrator CC 2014 and Adobe Edge Animate CC 2014 from the Creative Cloud.
b. Download the supplied files from the article, and unzip them to your Desktop.
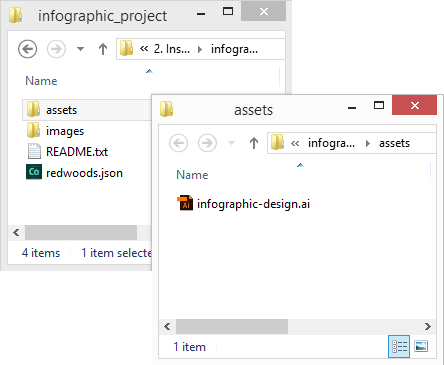
c. Open the infographic_project folder. You’ll use this folder as your project folder as you work (see Figure 2). Take a look at the infographic-design.ai file in the assets folder. This file contains the mockup for the design, and the vector graphics you’ll use for your background in Edge Animate.
2. Create your artwork in Illustrator.
a. Open the infographic-design.ai file located in the assets folder of the supplied files. Double-click on the file to launch Adobe Illustrator CC 2014.
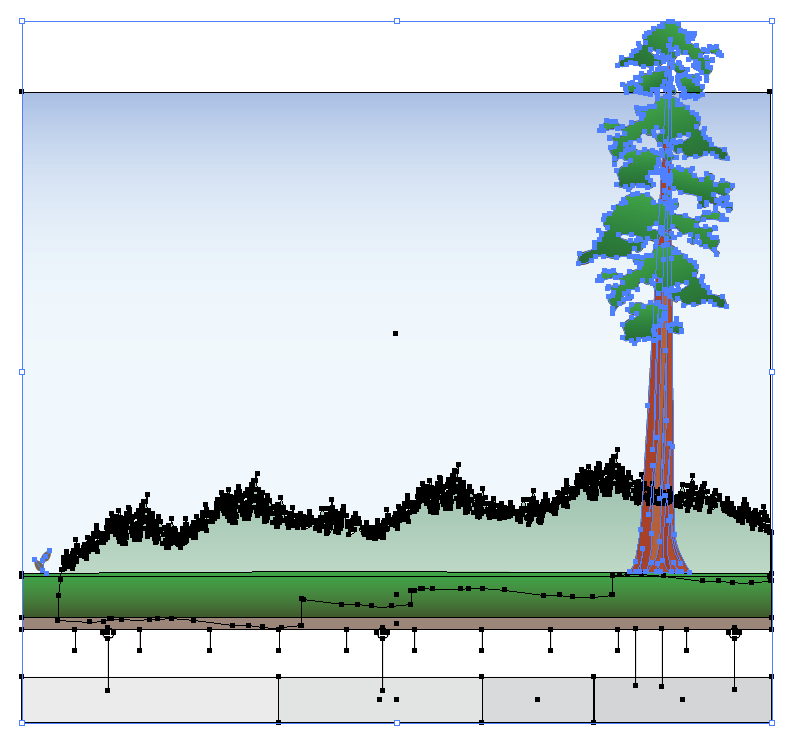
b. Take a moment to explore the design. You can see that the design is fully realized, and works as a standalone graphic to some extent. Although the text and timeline triggers appear in the mockup, you’ll omit those layers when you create the SVG file (see Figure 3). You’ll add the text and triggers in Edge Animate.
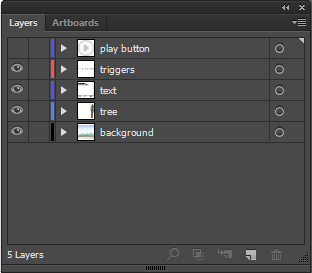
c. Hide or lock the text, triggers, and play button layers, and select all the remaining graphics on the tree and background layers (see Figure 4). These graphics will become your background after you create your composition in the next step.
Step 2: Build the static composition in Edge Animate
At this point, you’re ready move to Edge Animate CC 2014 to start work on your interactive composition. Leave Illustrator open, you’ll return to copy your background graphics in the following steps.
Follow these steps to layout the composition:
1. Setup the responsive composition.
a. Open the current version of Adobe Edge Animate CC 2014. You’ll use the new Responsive Scaling features to create a design that scales its size to the size of the screen viewing it.
b. Choose File > New, to create a new file. Save the file into the project folder with the name infographic.html. Notice that Edge Animate adds supporting files to the project folder as well.
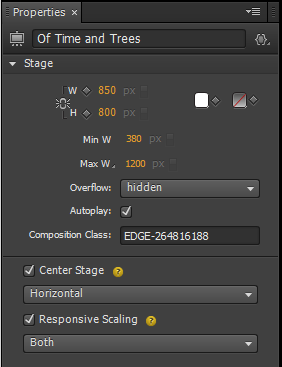
c. Update the Stage properties in the Properties panel to the following (see Figure 5):
-
• Title: Of Time and Trees
• W: 850
• H: 800
• Min W: 380
• Max W: 1200
• Center Stage: Checked, Horizontal
• Responsive Scaling, Checked, Both
2. Copy and paste the background graphics from Illustrator.
-
a. Return to Illustrator and make sure you have all the graphics on the tree and background layers selected. Copy the graphics to the clipboard.
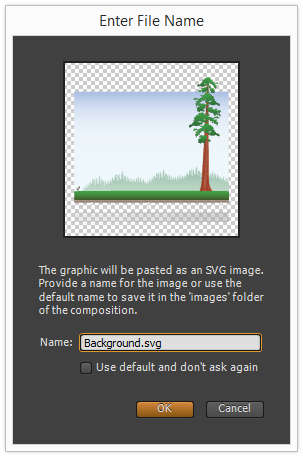
b. Return to Edge Animate, and paste the graphics onto the Stage. Notice that a dialog box appears asking you for the name of the resulting SVG file (see Figure 6). Enter the name Background.svg, and press OK.
3. Add text as HTML elements.
-
a. Add text above the background graphic using the Text tool in Edge Animate. (You can copy the text from the completed project files if you like.) In my mockup, I’m simply using Arial (or sans) font, but you can add web fonts or your own font choices here.
- The font sizes are as follows:
- Title: 48 Pt.
- Caption: 21 Pt.
- Timeline: 12 Pt.
- b. Select all the text, right click and choose Convert to Symbol. In the Create Symbol dialog box, name the symbol GridText, and press OK. Grouping the text inside a symbol cleans up the Stage (see Figure 7).
4. Save the file.
Step 3: Build the TimelineTrigger widget
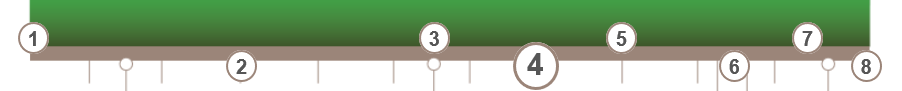
You’ll notice there are numbered timeline triggers in the mockup design. Rather than build 8 different graphics, you’ll build a single TimelineTrigger widget in Edge Animate (see Figure 8). What I’m calling a widget is simply an Edge Animate symbol that can be configured using a little code. The fun part is that the widget has its own timeline with animated states.
Follow these steps to build the TimelineTrigger widget:
1. Create the widget graphics and symbol.
a. Select the Ellipse Tool and draw a circle about 30 pixels in diameter. Select the Text Tool and add a text element above the circle. Make sure the name of the text element layer is “Text”.
b. Select both the circle and the text, right-click, and choose Convert to Symbol. In the Create Symbol dialog box, name the symbol TimelineTrigger, uncheck the Autoplay timeline option, and press OK.
c. Notice that the circle and text element now appear as a single grouped object. Double-click on the instance to enter its timeline.
d. At this point, you’ve left the main Stage timeline, and are now working in the TimelineTrigger symbol timeline. You can navigate back to the Stage using the Stage link on the top left of the Stage area.
2. Add labels to split the timeline into sections.
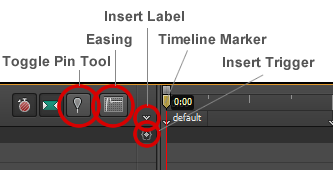
a. In the next steps, you’ll work with the timeline tools to add animated states to the widget. Take a look at Figure 9 to get familiar with the tool names and locations on the Timeline panel.
b. Drag the timeline marker to the 0 mark, and click on the Insert Label button to add a label. Type the text “default” into the label.
c. Add a label named “rollover” at the 1 second mark, and add another label named “rollout” at the 2 second mark. You’ll navigate to the labels to play specific states of the animation.
3. Add the rollover state animation.
a. Drag the timeline marker to the 1 second mark, and click the Toggle Pin button to select it. Notice that a blue pin icon appears on the timeline marker.
b. Drag the timeline marker to the 1.5 second mark, and select the ellipse graphic and change its width and height amounts to 150% in the Properties panel. Select the text and change its font size to a larger number. Position the scaled graphics so they appear centered inside the symbol, Notice that colored animation spans appear on the timeline between the pinned points.
c. Select the animation spans, and click on the Easing button. Choose the Ease Out Elastic option.
4. Add the rollout state animation.
a. Deselect the Toggle Pin Tool and move the timeline marker to the 2 second mark.
b. Select the Toggle Pin Tool again, and drag the timeline marker to the 2.5 second mark. Change the ellipse’s width and height scale back to 100%, and change the text’s font size back to the original size in the Properties panel. Position the graphics as needed.
c. Deselect the Toggle Pin Tool.
d. Select the new animation spans, and click on the Easing button. Choose the Ease Out Elastic option.
5. Add stop action triggers along the timeline.
a. Drag the timeline marker to the 1.5 second mark, and click on the Insert Trigger button. Notice that a Trigger icon appears on the timeline, and the Actions panel opens.
b. Click on the Playback button under the Pick an action section, and then click the Stop button (see Figure 10).
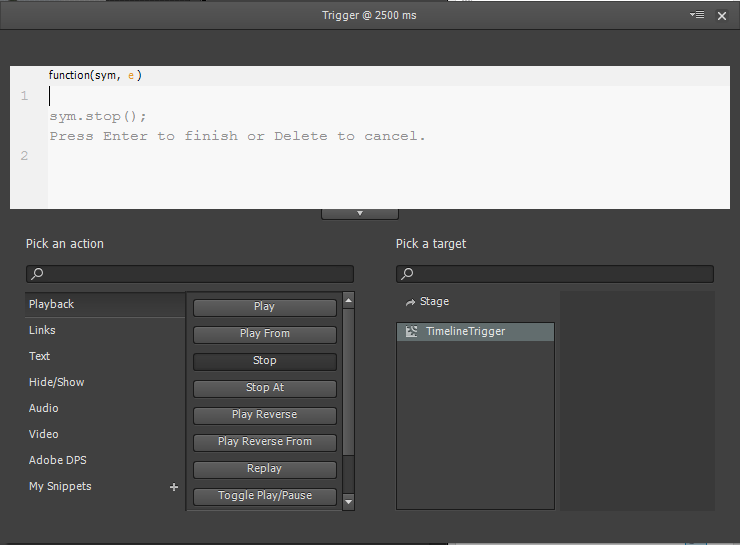
c. Select the TimelineTrigger target under the Pick a target section, and then press the Enter key to commit the code.
d. Close the panel.
e. Add another stop action at the 2.5 second mark.
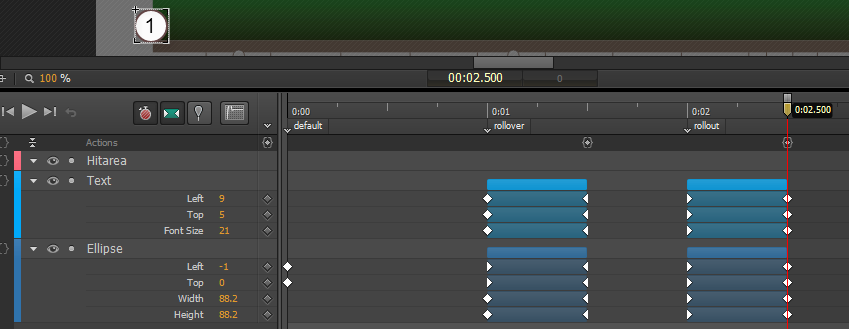
6. Add a “hitarea” element.
a. Select the Ellipse tool, and draw a circle above the other graphics.
b. Select the circle and set its opacity to 0 in the Properties panel.
c. Name the circle layer “Hitarea” in the Properties panel. Your timeline should look like Figure 11 at this point.
Add code to the symbol to control the states.
a. Click on the Open Actions button next to the TimelineTrigger element in the Elements panel, and choose the creationComplete event. (Note that this step assumes that you’re still editing inside the TimelineTrigger timeline. You can also access the TimelineTrigger actions by choosing Window > Code to launch the Code panel.)
b. You can use the Actions panel editor to guide you through adding actions, or you can type code directly into the text editor. From here on out, you’ll be pasting code snippets into the Actions panel.
c. Copy and paste the following code into the Actions panel:
function handleEvent( event ){

	if(!sym.getVariable("selected") )
	{
		switch( event ){
			case "mouseover":
				sym.play("rollover");
				break;
			case "mouseout":
				sym.play("rollout");
				break;
			case "click":
				// Callback to controller

				break;
		}
	}
}
// Relay trigger events to handleEvent
sym.$("Hitarea").on("mouseover mouseout click", function(e)
{
	handleEvent(e.type);
});
// Set variable defaults
sym.setVariable("id", null);
8. Create widget instances and position them on the timeline.
a. Click on the Stage link on the top left of the Stage area to return to the Stage timeline.
b. Position the existing TimelineTrigger instance on the left edge of the timeline graphic.
c. Copy and paste the instance to create a total of eight instances. Rename the instances in the Timeline or Elements panel, so that they following the naming convention “Trigger[n]”, where [n] is a number between 0 and 7.
d. Position the instances along the timeline as seen in Figure 8.
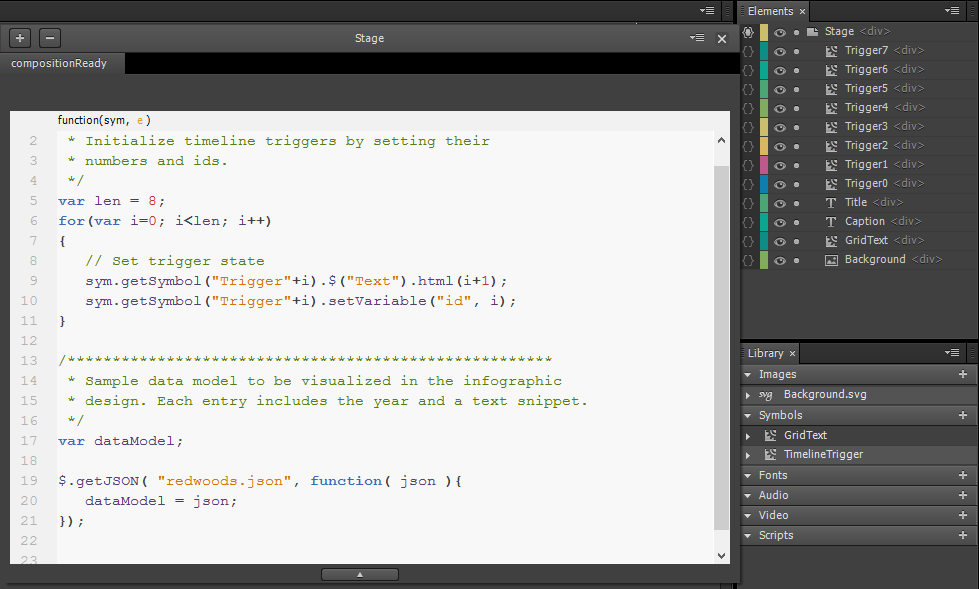
9. Add code on the Stage to initialize the widgets.
a. While editing the Stage timeline, click on the Open Actions button next to the Stage element in the Elements panel. Choose the compositionReady event.
b. Copy and paste the following code in the Actions panel:
/******************************************************
 * Initialize timeline triggers by setting their
 * numbers and ids.
 */
var len = 8;
for(var i=0; i<len ; i++)
{
	// Set trigger state
	sym.getSymbol("Trigger"+i).$("Text").html(i+1);
	sym.getSymbol("Trigger"+i).setVariable("id", i);
}
10. Save the file.
Essentially the pattern you just learned is an easy way to create buttons, and elements with states, in Edge Animate. You’ll return to work on the timeline triggers in Step 6.
Step 4: Build the DetailPanel widget
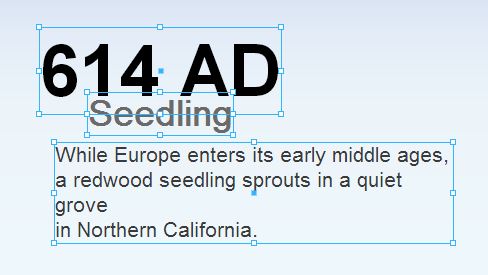
Next, you’ll create a second widget that displays detail text (see Figure 12). This time, you’ll use two symbols. One will layout three text fields, while the other animates the layout on and off the screen.
Follow these steps to build the widget:
1. Create the text layout and symbols.
-
a. Use the Text Tool to draw three text elements on the screen. Position them to look like Figure 12, using the following font sizes:
- Title: 72 Pt.
- Caption: 36 Pt.
- Details: 21 Pt.
- Select the three text fields, and convert them into a symbol named DetailPanel. Notice that the text fields appear grouped in the DetailPanel instance.
c. Position the symbol instance in the left center of the Stage.
d. Right-click on the instance, and convert it to a symbol named DetailPanelAnimation. Double-click on the resulting instance to enter the DetailPanelAnimation timeline. This step nests the text layout symbol in a wrapper symbol, so the text layout symbol can be animated more easily as a single element.
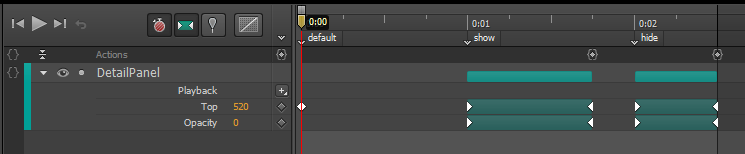
2. Add labels to create sections in the timeline.
-
a. Add the following labels to the DetailPanelAnimation timeline:
- 0.00: default
- 0.01: show
- 0.02: hide
3. Setup the default state.
a. Select the graphics at the 0 mark, and drag them off the bottom of the Stage.
4. Add the show state animation.
-
a. Setup an animation between the 1 second and 1.75 second marks. The panel should animate from a starting point of a few inches below the target position.
b. Set the easing to Ease Out Back.
5. Add the hide state animation.
-
a. Setup an animation between the 2 second and 2.75 second marks. The panel should animate from the target position, to the final position a few inches above. In the end, the DetailPanelAnimation timeline should look like Figure 13.
Add stop actions to the end of the show and hide animation spans to pause the text after each animated state.
Save the file.
In the next steps, you’ll import a data source, and bind all the widgets together.
Step 5: Add a data source
So far you’ve built the view that will display your infographic data, but you still need a data source. In this step you’ll import a supplied JSON file that contains a list of facts related to the eight points along the timeline design. You can view and edit the JSON file in a text editor like Adobe Dreamweaver CC 2014 or Adobe Edge Code CC Preview.
Follow these steps to import the details list:
1. Return to the Stage’s compositionReady event by clicking on the Open Actions button next to the Stage element in the Elements panel.
2. Copy and paste the following code below the initialization code:
/******************************************************
 * Sample data model to be visualized in the infographic
 * design. Each entry includes the year and a text snippet.
 */
var dataModel;

$.getJSON( "redwoods.json", function( json ){
	dataModel = json;
});
3. The Actions panel should look something like this (see Figure 14).
Save the file.
The code uses the built-in jQuery getJSON command to load the redwoods.json file. In the next step you’ll route the data to the view.
Step 6: Bind the triggers to the detail panel
You’ll finish the project by adding a little more code to the Stage timeline and the TimelineTrigger symbol timeline. The goal is to have each trigger instance callback to the Stage timeline. The Stage timeline essentially acts as a controller binding the data model, to the HTML view.
Follow these steps to bind the widgets to the data source:
1. Update the Stage code with a callback function.
a. Return to the Stage’s compositionReady code in the Actions panel.
b. Add the following code below the rest:
/****************************************************
 * Handle clicks from timeline triggers.
 * Process events here to handle the triggers
 * as a group.
 */
var index = -1;

function handleClickEvent( id ){

	// Handle timeline trigger clicks
	showDetail(id);
}
// Expose to globally accessible scope
sym.setVariable("handleClickEvent", handleClickEvent);
2. Update the TimelineTrigger code.
a. Return to the TimelineTrigger’s creationComplete code in the Actions panel. You can either enter the TimelineTrigger’s timeline and use the Elements panel, or use the Code panel to get there.
b. Copy and paste the following code inside the switch statement, in the “click” event handler, in the handleEvent function:
// Callback to controller function
var id = sym.getVariable("id");
var callback = sym.getComposition().
		getStage().
getVariable("handleClickEvent");
callback( id );
3. Add supporting functions to the Stage code.
-
a. Return to the Stage’s compositionReady code.
b. Copy and paste the following code below the rest:
/*****************************************************
 * Controller for data and view state
 */
var timeoutDelay = 500;

function setState( id, state ){

	var symbol = sym.getSymbol(id);
	if( symbol ){
	    symbol.setVariable("selected", state);
	    symbol.play(state ? "rollover" : "rollout");
	}
}

function showDetail( id ){

	// Reset last timeline selection
	setState("Trigger"+index, false);

	// Save new selection
	index = id;

	// Select next timeline trigger
	setState("Trigger"+index, true);

	// Show details
	var data = dataModel[index];
	var anim = sym.getSymbol("DetailPanelAnimation");
	var details = anim.getSymbol("DetailPanel");
	if( details )
	{
		 // Transition out
		 if( anim.getPosition() > 0 ){
			anim.play("hide");
		 }

	// Transition in with new data...
setTimeout(function()
	{
		details.$("Year").html(data.year+" AD");
		details.$("Caption").html(data.title);
		details.$("Details").html(data.text);
		anim.play("show");
	},
	timeoutDelay);
	}
}
4. Save the file.
Choose File > Preview in Browser to preview your work. If you run into problems compare your work to the completed files for reference.
Where to go from here
Try to take the concepts you learned in the tutorial, and build more interactivity and rich media into the infographic. For example, you’ll notice that the “extra credit” completed file has a play button and a timer that can play a slideshow. Deconstruct the file, and see if you can setup your own work as a slideshow. Have fun with it.
Frequently Asked Questions (FAQs) about Creating Infographics with Adobe Edge Animate CC 2014
What is Adobe Edge Animate CC 2014 and how does it work?
Adobe Edge Animate CC 2014 is a powerful tool that allows you to create interactive and animated web content. It uses HTML5, JavaScript, and CSS3, which are standard web technologies, to create animations and interactive content. This means that the content you create can be viewed on any device that supports these web standards, including smartphones and tablets. The interface is similar to other Adobe products, making it easier for those familiar with Adobe software to learn and use.
How can I start creating an infographic with Adobe Edge Animate CC 2014?
To start creating an infographic, you first need to open Adobe Edge Animate and create a new project. You can then add elements to your project, such as text, images, and shapes, and animate them using the timeline and properties panel. You can also add interactivity to your elements, such as making them respond to user actions like clicks or mouse movements.
Can I import external assets into my Adobe Edge Animate project?
Yes, Adobe Edge Animate allows you to import external assets such as images, audio files, and even other HTML files. This can be done through the “File” menu, by selecting “Import”. You can then navigate to the file you want to import and select it.
How can I add interactivity to my infographic?
Interactivity can be added to your infographic by using the “Actions” panel in Adobe Edge Animate. This panel allows you to add actions to your elements, such as making them respond to user clicks or mouse movements. You can also use JavaScript to create more complex interactions.
How can I preview my infographic before publishing it?
Adobe Edge Animate allows you to preview your infographic directly in the application by clicking on the “Preview” button in the toolbar. This will open a new browser window where you can see how your infographic will look and behave in a real web environment.
Can I publish my infographic directly from Adobe Edge Animate?
Yes, Adobe Edge Animate has a built-in publishing feature that allows you to publish your infographic directly to the web. You can choose to publish your project as a static HTML file, or as an interactive HTML file that includes all the necessary JavaScript and CSS files.
How can I optimize my infographic for mobile devices?
Adobe Edge Animate allows you to create responsive designs that adapt to different screen sizes. You can use the “Responsive Design” feature to specify how your infographic should adapt to different screen sizes, and you can preview how your infographic will look on different devices using the “Preview” feature.
Can I use Adobe Edge Animate to create other types of web content?
Yes, while this guide focuses on creating infographics, Adobe Edge Animate can be used to create a wide range of web content, including interactive websites, online advertisements, and digital magazines.
Do I need to know how to code to use Adobe Edge Animate?
While knowing how to code can certainly help, it’s not necessary to use Adobe Edge Animate. The software has a visual interface that allows you to create animations and add interactivity without writing any code. However, if you do know how to code, you can use JavaScript to create more complex interactions.
Where can I learn more about using Adobe Edge Animate?
Adobe provides a range of resources for learning how to use Edge Animate, including tutorials, user guides, and a community forum where you can ask questions and share tips with other users. You can also find many tutorials and guides online.
 Dan Carr
Dan Carr is lead developer of Dan Carr Design in Southern California. With fifteen years’ experience collaborating with Adobe, Dan has produced training materials, technical articles, and features available in Flash, Flex, and more. Dan’s most recent work specializes in gaming, video, and design in Flash, HTML5, and iOS.