
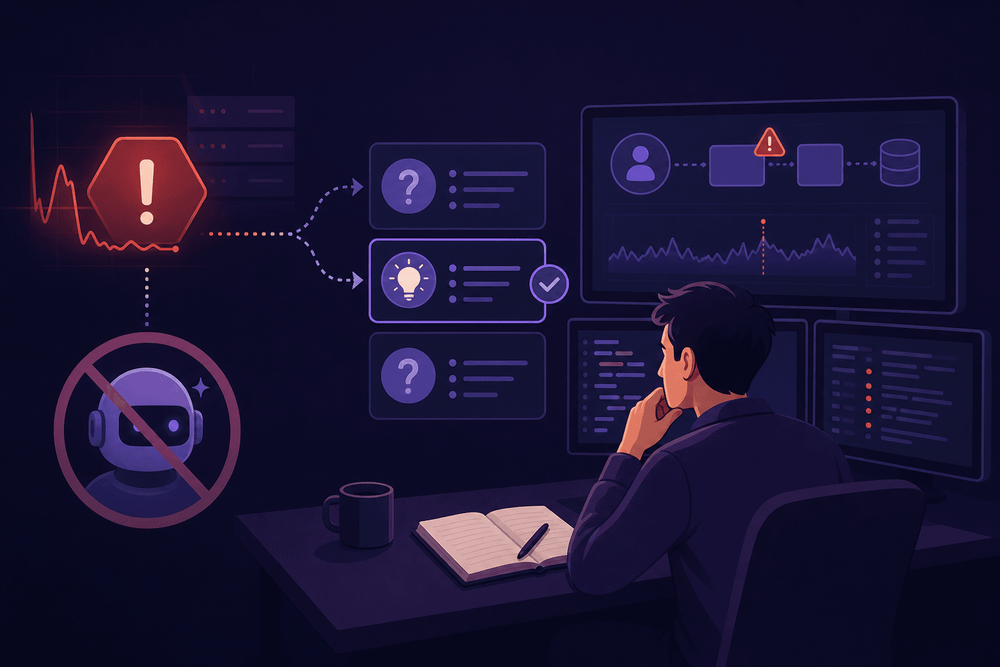
Hypothesis-driven debugging exists precisely for moments when confident-sounding AI fixes collide with the messy reality of production systems. This article teaches a repeatable, hypothesis-driven debugging workflow implemented in JavaScript, applying the scientific method to software defects.
Table of Contents
- Why AI Auto-Fix Isn't Enough
- Where AI Debugging Tools Break Down
- The Hypothesis-Driven Debugging Workflow
- Implementing the Workflow in JavaScript: A Production Debugging Example
- Hypothesis-Driven Debugging Checklist
- Integrating AI Tools Within the Workflow
- Think Like a Scientist, Code Like an Engineer
Why AI Auto-Fix Isn't Enough
Picture a familiar scene: a production Node.js service starts throwing 500 errors at 2 AM. The on-call developer grabs the stack trace, pastes it into an AI coding assistant, and receives a confident, well-formatted suggestion. The fix looks reasonable. It passes a quick code review. It gets deployed. And twenty minutes later, a different endpoint starts failing because the AI-suggested change corrupted shared request state in middleware. Hypothesis-driven debugging exists precisely for moments like this, when confident-sounding AI fixes collide with the messy reality of production systems.
AI debugging tools excel at pattern-matched, well-documented bugs. They recognize common anti-patterns, suggest known fixes for frequently encountered errors, and accelerate routine troubleshooting. But production failures rarely fit neatly into common patterns. They emerge from unique intersections of application state, deployment environment, timing, concurrency, and data shape. When an AI tool lacks the full context of a running system, its suggestions are extrapolations from incomplete context, ranging from correct to dangerously wrong depending on how much runtime state the tool can access.
This article teaches a repeatable, hypothesis-driven debugging workflow implemented in JavaScript. The approach applies the scientific method to software defects: observe the failure, form a falsifiable hypothesis about its cause, design a minimal test, execute it, and iterate. This methodology does not replace AI tooling. It provides a structured fallback for the cases where AI suggestions fall short.
Where AI Debugging Tools Break Down
Pattern Matching vs. Root Cause Analysis
AI coding assistants work by matching symptoms to patterns observed across vast training corpora. When a developer provides a stack trace pointing to a TypeError: Cannot read properties of undefined, the AI recognizes the pattern and suggests null checks or optional chaining. That works fine when the bug is, in fact, a straightforward null reference.
Production failures, however, frequently stem from multiple interacting causes. Consider a race condition in an asynchronous JavaScript data pipeline where two concurrent requests compete for a shared in-memory cache. The symptom might look like a null reference error because the cache entry gets evicted between the existence check and the read. An AI tool sees the undefined access and recommends a guard clause. That guard clause masks the symptom while leaving the race condition intact, ready to surface in a harder-to-diagnose form later.
The core limitation is that AI tools operate on static snapshots of code and error output. They lack access to runtime state, cannot reproduce timing-dependent behavior, and cannot trace how a specific deployment configuration interacts with application logic.
The Hallucinated Fix Problem
AI-generated fixes carry a particular risk: they look plausible. They use correct syntax, follow reasonable patterns, and often come with explanatory comments. This surface-level correctness can pass code review, especially under the time pressure of an active production incident. But plausibility is not correctness. A fix that does not address the actual root cause is, at best, a temporary patch and, at worst, an additional source of defects. Deploying unverified AI fixes can mask the real bug, make it harder to reproduce, or introduce new failure modes that only manifest under specific conditions.
When to Stop Asking AI and Start Investigating
A practical heuristic: if an AI tool provides two contradictory suggestions for the same problem, or if the suggested fix addresses what is failing without explaining why it fails, switch to hypothesis-driven debugging. Another signal is when the AI's fix works in isolation but fails under the conditions that trigger the production bug. These are indicators that the problem requires investigative reasoning, not pattern matching.
The Hypothesis-Driven Debugging Workflow
Step 1: Observe and Gather Evidence
Before forming any theory about the cause, collect raw evidence. This means logs, error messages, complete stack traces, request and response payloads, environment state (Node.js version, dependency versions, memory usage, active connections), and the sequence of events leading to the failure. The goal is to separate what is known from what is assumed. Write down both explicitly. Assumptions are not evidence; they are hypotheses waiting to be tested. Resist the urge to jump to a fix based on the first clue. Premature conclusions are the single most common source of wasted debugging time.
Step 2: Formulate a Hypothesis
Write a single, falsifiable statement about the root cause. Not "something is wrong with the database connection" but rather: "The 500 error occurs because the Redis session lookup returns undefined when the TTL expires mid-request." A good hypothesis is specific enough that a single test can confirm or refute it. Constrain yourself to one hypothesis at a time. Pursuing multiple theories simultaneously leads to ambiguous results and muddled reasoning.
Step 3: Design a Test
Identify the smallest possible experiment that can confirm or refute the hypothesis. This might be a targeted log injection at a specific code path, a unit test that simulates the suspected condition, or a controlled reproduction in a staging environment. The test should change only one variable. If the test requires altering multiple things, it cannot clearly confirm or refute the specific hypothesis.
Step 4: Execute and Analyze
Run the test. Capture the results. Compare them against the prediction embedded in the hypothesis. If the hypothesis predicted that the Redis lookup returns undefined under TTL expiration, but the test shows the lookup consistently returns valid data even past TTL, the hypothesis is refuted. That is progress, not failure. Update the mental model based on the new evidence and return to Step 2 with a refined understanding.
Step 5: Document and Fix
Once the root cause is confirmed through evidence, record the full chain: the initial observation, each hypothesis tested, the evidence that refuted or confirmed each one, and the final fix with a rationale for why it addresses the root cause. This documentation serves two purposes. It prevents future misdiagnosis by human teammates who encounter similar symptoms. And it provides context that includes root cause, evidence, and hypothesis chain, which can be fed back into AI tools to improve their suggestions for related problems.
Implementing the Workflow in JavaScript: A Production Debugging Example
The Scenario: Intermittent API Timeout in an Express.js Service
An Express.js 4.x API endpoint intermittently returns 504 Gateway Timeout errors under moderate load. The failures are not consistent; they appear roughly 5-10% of the time under normal traffic. A developer pastes the error logs into an AI assistant, which suggests increasing the server timeout value from 30 seconds to 60 seconds. This is symptom treatment, not root cause analysis. The requests are not genuinely slow; something is preventing them from completing.
Important context about Express 4.x and async errors: Express 4.x does not automatically catch errors thrown from async route handlers. If an async handler throws (or returns a rejected Promise) and does not explicitly call next(err), Express never learns about the error. Without a registered four-parameter error-handling middleware (app.use((err, req, res, next) => { ... })), unhandled async errors leave the response open indefinitely, eventually causing a gateway timeout.
Here is the route handler and middleware chain exhibiting the bug:
const express = require('express');
const app = express();

// Assumes:
// const { verifyToken } = require('./auth');
//   verifyToken(token: string): Promise<{id: string}> — throws on invalid token
// const db = require('./db');
//   db.query(text: string, params: any[]): Promise<{rows: any[]}> — a pg Pool instance

async function authMiddleware(req, res, next) {
  try {
    const user = await verifyToken(req.headers.authorization);
    req.user = user;
    next();
  } catch (err) {
    console.warn('Auth failure:', { requestId: req.headers['x-request-id'], message: err.message });
    res.status(401).json({ error: 'Unauthorized' });
  }
}

app.get('/api/orders', authMiddleware, async (req, res) => {
  try {
    const orders = await db.query(
      'SELECT id, created_at, status, total FROM orders WHERE user_id = $1',
      [req.user.id]
    );
    res.json({ orders: orders.rows });
  } catch (err) {
    console.error('Order fetch failed:', err);
    res.status(500).json({ error: 'Internal server error' });
  }
});

// NOTE: No error-handling middleware is registered. In Express 4.x,
// this means any async error that bypasses the route handler's own
// try/catch will leave the response hanging indefinitely.

app.listen(process.env.PORT || 3000);
On the surface, this looks correct. The AI tool sees no obvious issues and defaults to suggesting a timeout increase.
Applying Step 1: Structured Evidence Collection
A lightweight diagnostic logging utility can instrument the request lifecycle to capture timing data and middleware execution order. This utility is for environments where APM tooling (such as Datadog, New Relic, or OpenTelemetry) is unavailable or cannot be instrumented quickly during an incident.
const crypto = require('crypto');

function createDiagnosticLogger(rawRequestId) {
  const requestId = String(rawRequestId).replace(/[^\w\-]/g, '').slice(0, 128);
  const entries = [];
  const startNs = process.hrtime.bigint();
  const MAX_ENTRIES = 200;

  return {
    log(phase, detail = {}) {
      if (entries.length >= MAX_ENTRIES) return;
      entries.push({
        requestId,
        phase,
        elapsed: Number(process.hrtime.bigint() - startNs) / 1e6,
        timestamp: new Date().toISOString(),
        ...detail
      });
    },

    wrap(name, middlewareFn) {
      return async (req, res, next) => {
        this.log(`${name}:enter`);
        try {
          await middlewareFn(req, res, (...args) => {
            this.log(`${name}:next-called`);
            next(...args);
          });
        } catch (err) {
          this.log(`${name}:error`, { message: err.message });
          // Forward to Express error pipeline instead of re-throwing
          // into an unhandled async context.
          next(err);
          return;
        }
        if (!res.headersSent) {
          this.log(`${name}:exit`);
        } else {
          this.log(`${name}:response-sent`);
        }
      };
    },

    // WARNING: For diagnostic use only. The JSON.stringify call has
    // meaningful CPU cost per request. Remove or gate behind a feature
    // flag before deploying to production traffic.
    dump() {
      const snapshot = [...entries];
      console.log(JSON.stringify(snapshot));
      return snapshot;
    }
  };
}

// Integration: attach a per-request diagnostic logger as middleware
// app.use((req, res, next) => {
//   req.diagLogger = createDiagnosticLogger(
//     req.headers['x-request-id'] || crypto.randomUUID()
//   );
//   next();
// });
//
// Then wrap middleware for instrumentation:
// app.get('/api/orders',
//   req.diagLogger.wrap('auth', authMiddleware),
//   async (req, res) => { /* ... */ }
// );
This utility wraps middleware functions to record when they enter, when they call next(), and when the middleware function itself returns. The elapsed timing relative to request start reveals where time is being spent or, critically, where execution stalls. The wrap() method forwards any caught errors to Express via next(err) rather than re-throwing into an unhandled async context, ensuring the diagnostic tool does not itself cause failures. The :exit log only fires when the middleware returns without having already sent a response, preventing misleading diagnostic output.
Applying Steps 2 Through 4: Hypothesis, Test, Analyze
With the diagnostic logger deployed, three hypothesis iterations proceed:
Hypothesis A: "The database query is slow under load." The diagnostic logs show the database query consistently returning in under 50ms, even during periods when 504 errors occur. The timing data directly refutes this: the database is not the bottleneck.
Hypothesis B: "Middleware ordering causes a blocking operation before the async handler." Start with the logs. They show authMiddleware:enter, authMiddleware:next-called, and the route handler all executing in the expected order. Reordering middleware produces no change in behavior. The evidence refutes this hypothesis.
Hypothesis C: "An unhandled async error in the route handler leaves the response hanging because Express 4.x has no error-handling middleware registered." The diagnostic logs reveal a telling pattern: on failing requests, the logs record no route-handler completion entry. The handler throws, but the error never reaches Express's error pipeline. Because no four-parameter error-handling middleware (app.use((err, req, res, next) => { ... })) is registered, and the route handler does not call next(err) in its catch block for all error paths, the response remains open until the gateway times out.
A fix that does not address the actual root cause is, at best, a temporary patch and, at worst, an additional source of defects.
Here is the middleware before the fix:
// BEFORE: no error-handling middleware registered; async errors in
// downstream handlers that bypass their own try/catch go unhandled
async function authMiddleware(req, res, next) {
  try {
    const user = await verifyToken(req.headers.authorization);
    req.user = user;
    // next() is called, but Express 4.x does not return a Promise
    // from next(). If the downstream async handler throws and its
    // own try/catch doesn't handle every error path, the error
    // vanishes silently and the response hangs.
    next();
  } catch (err) {
    res.status(401).json({ error: 'Unauthorized' });
  }
}
The fix requires two changes — not just a single keyword:
- Ensure the route handler explicitly calls
next(err)so Express can route errors to the error-handling pipeline. - Register a four-parameter error-handling middleware to catch and respond to those errors.
// AFTER: route handler forwards errors with next(err) and guards req.user
app.get('/api/orders', authMiddleware, async (req, res, next) => {
  try {
    if (!req.user || !req.user.id) {
      return res.status(401).json({ error: 'Unauthorized' });
    }
    const orders = await db.query(
      'SELECT id, created_at, status, total FROM orders WHERE user_id = $1',
      [req.user.id]
    );
    res.json({ orders: orders.rows });
  } catch (err) {
    console.error('Order fetch failed:', err);
    next(err); // Forward to Express error-handling middleware
  }
});

// Error-handling middleware — must have four parameters.
// Register this AFTER all route definitions.
app.use((err, req, res, next) => {
  console.error(JSON.stringify({
    message: err.message,
    stack: err.stack,
    path: req.path,
    method: req.method
  }));
  if (!res.headersSent) {
    res.status(500).json({ error: 'Internal server error' });
  } else {
    // Delegate to Express default handler to abort the response stream
    next(err);
  }
});
Express 4.x does not natively handle errors thrown from async route handlers. Without next(err) in the route handler's catch block and a registered four-parameter error-handling middleware, unhandled async errors leave the response permanently open. The root cause is the absence of this error-handling infrastructure, not a missing await keyword. The timeout only manifests when the downstream handler actually throws on an error path not covered by its own try/catch, which depends on runtime conditions like database connection availability and request payload validity. This is exactly the kind of context-dependent bug that AI tools miss: the absence of error-handling middleware in async Express 4.x apps is a widespread pattern that static analysis tools and AI assistants do not consistently flag.
Note: Express 5.x (currently in release candidate) handles async errors natively — it automatically forwards rejected Promises from async handlers to the error-handling middleware. The bug described here is specific to Express 4.x.
Applying Step 5: Documenting the Root Cause
A structured debugging log entry captures the full investigation for the team knowledge base:
{
  "incident": "PROD-2847",
  "symptom": "Intermittent 504 Gateway Timeout on GET /api/orders",
  "environment": {
    "node": "20.11.0",
    "express": "4.18.2",
    "deploy": "ECS Fargate"
  },
  "ai_suggestion": "Increase server timeout to 60s — rejected as symptom treatment",
  "hypotheses": [
    {
      "id": "A",
      "statement": "Database query slow under load",
      "result": "refuted",
      "evidence": "Query returns <50ms in diagnostic logs during failures"
    },
    {
      "id": "B",
      "statement": "Middleware ordering causes blocking",
      "result": "refuted",
      "evidence": "Execution order correct per diagnostic logs"
    },
    {
      "id": "C",
      "statement": "Unhandled async error due to missing error-handling middleware",
      "result": "confirmed",
      "evidence": "No route-handler completion log on failing requests; no 4-param error middleware registered"
    }
  ],
  "root_cause": "Express 4.x does not catch async route handler errors automatically. No error-handling middleware was registered, and the route handler did not call next(err) on all error paths. Unhandled async errors left responses open until gateway timeout.",
  "fix": "Add next(err) in route handler catch block; register 4-parameter error-handling middleware as last app.use(); add req.user guard to prevent TypeError on misconfiguration",
  "regression_test": "Mount authMiddleware with error-handling middleware; send request whose async handler throws; assert response returns 500 within 1000ms rather than hanging."
}
This template is reusable across incidents. It preserves the reasoning chain, not just the fix, which means future developers encountering similar symptoms can trace the logic rather than guessing.
Hypothesis-Driven Debugging Checklist
Before You Start
- Reproduce or confirm the failure with evidence (logs, screenshots, metrics)
- Document the environment: Node.js version, dependencies (especially Express major version), deployment target, traffic pattern
- Note what AI tools already suggested and why those suggestions are insufficient
During Investigation
- Write one falsifiable hypothesis before touching code
- Design the minimum test to confirm or refute
- Change only one variable per test
- Log your results, even negative results eliminate possibilities
- If refuted, update your mental model before forming the next hypothesis
- If three consecutive hypotheses are refuted without new evidence, stop and re-examine your original evidence collection for gaps
After the Fix
- Confirm the fix resolves the original failure in the original environment
- Write a regression test that encodes the root cause
- Document the full hypothesis chain for the team knowledge base
- Feed the root cause back to your AI tool as context for future prompts
Integrating AI Tools Within the Workflow
AI as Evidence Gatherer, Not Decision Maker
The most productive role for AI during hypothesis-driven debugging is as a research assistant, not an authority. AI tools can summarize large volumes of logs, surface correlations between error spikes and deployment timestamps, and generate test scaffolding. They can also propose hypotheses worth evaluating. For instance, given the diagnostic logs from the Express example above, an AI tool might suggest "check whether the error-handling middleware is registered," which is a useful lead for a developer to test even if the tool cannot verify it. What AI should not do is select the hypothesis or validate the fix. The developer retains ownership of hypothesis selection, test design, and root cause confirmation. Treating AI output as input to a human-driven investigation, rather than as the investigation's conclusion, avoids the hallucinated fix problem while still extracting value from the tooling.
Feeding Confirmed Root Causes Back to AI
After completing a debugging investigation, the documented root cause and hypothesis chain become valuable context for future AI interactions. Providing this documentation as part of a prompt, for example, "In this codebase, we previously found that a missing Express 4.x error-handling middleware caused intermittent 504 errors when async route handlers threw unhandled errors," gives the AI tool domain-specific context it cannot derive from its general training data. This creates a feedback loop: structured debugging produces documentation that includes root cause, evidence, and hypothesis chain, which improves AI suggestion quality on subsequent incidents and, for similar async-error-class bugs, reduces how often full manual investigation is needed.
Think Like a Scientist, Code Like an Engineer
AI auto-fix tools are valuable for well-documented, pattern-matched bugs. For production failures that involve stateful interactions, timing dependencies, and environment-specific conditions, they remain unreliable because their analysis is limited to the code snapshot they receive, not the runtime context where the bug lives. The hypothesis-driven debugging workflow provides a systematic, repeatable methodology that fills that gap. It does not compete with AI tooling; it complements it by providing the structured reasoning that pattern matching cannot deliver.
The next time a production incident resists AI-suggested fixes, apply the checklist. Write the hypothesis before touching the code. Run one test at a time. Document the chain of reasoning.
In the Express 4.x example above, the fix was not a timeout increase or a guard clause; it was two missing pieces of error-handling infrastructure that no amount of pattern matching would have surfaced. Evidence found it. A structured process made that evidence legible.