

The AIR 1.5 update to Adobe’s flagship RIA platform is here, and with it a host of new features to supercharge your development. In this article we’ll look at the fantastic new debugging system, available in the Aptana IDE. Once again there will be a quiz at the end, so pay attention! The first 200 people to submit their answers will receive a copy of The Adobe Flash Platform ActionScript Reference for Rich Internet Application Development (that’s the print version) delivered to their door for free, thanks to Adobe.
Key Takeaways
- The AIR 1.5 update to Adobe’s flagship RIA platform comes with new features including a comprehensive debugging system, available in the Aptana IDE, which allows for step-by-step debugging, breakpoints, and watches.
- The AIR HTML Introspector, part of the AIR 1.5 debug launcher, enables developers to keep an eye on script execution and inspect objects in real time.
- The latest update of the Aptana plugin integrates a debugging platform that allows developers to pause JavaScript, inspect the structure of DOM nodes, and view defined functions on a file-by-file basis.
- The AIR toolchain in Aptana serves as a versatile debugging environment for standard web pages, making AIR a powerful web-based platform and a must-see for all web developers.
Getting Started
Before we begin, make sure you have the latest update to Aptana and to the AIR plugin. You can install these using the instructions in our previous AIR article, under the section, A Powerful Tool for Building AIR Apps.
The latest updates are critical for this tutorial; if in doubt, restart Aptana and check for updates using Help > Check for Aptana Updates Now. You should have at least Aptana Studio 1.2.1 and the Apollo/AIR plugin 1.2.1. Use Help > About Aptana Studio to check your Aptana version, and click on the brown box to check your Aptana AIR version.
Everything we need to take the debugger for a spin is included. We’ll be using the Adobe AIR 1.5 application template, the AIR Introspector framework, and the jQuery framework.
What’s New?
The AIR 1.0 release included a useful but limited debugging tool in the AIR HTML Introspector. With the new tools in the AIR 1.5 debug launcher, Aptana has managed to recreate the debugging workflow in Aptana Studio, and provide step-by-step debugging, breakpoints, watches, and more. In this tutorial, we’ll run through how to debug AIR projects from start to finish. Veteran AIR developers can skip ahead to the Debugging on Wheels section.
Creating a Project for Debugging
Once Aptana is set up, close it, and fire it up again. You should see the opening screen:
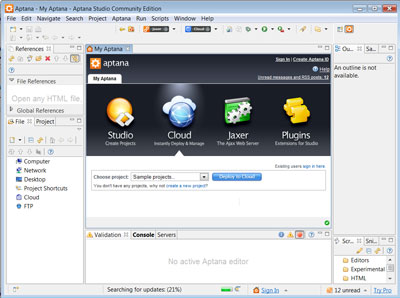
Most of this workbench is irrelevant to AIR debugging, so we can simplify the perspective by closing all the views except Project.
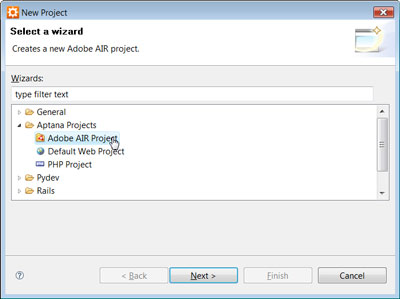
Let’s create a new AIR project; open File > New > Project under Aptana Projects, and select Adobe AIR Project.
Click Next and give your project a name – I’ve chosen “Debug”.
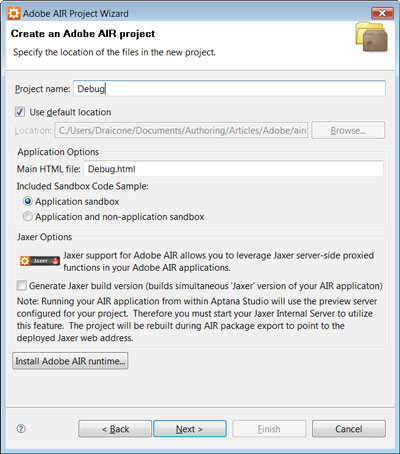
Click Next, accept the default Application Properties, and click Next again. The default Window Options should be fine so click Next once more, and the Import AIR Frameworks dialog appears.
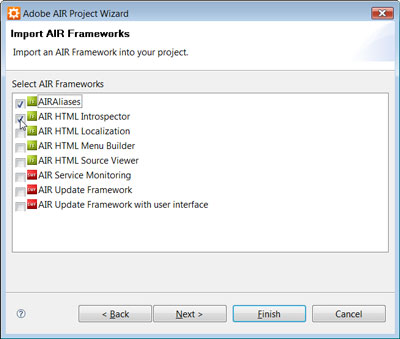
We’ll need AIRAliases and AIR HTML Introspector for this project. The latter remains unselected by default so add it and click Next.
Adobe AIR’s debugging system plays nicely with JavaScript frameworks. Add your framework of choice in the Import JavaScript Library dialog. Hit Finish, and we’re ready to roll!
Tracking Script Execution
Aptana has created a set of sample files to demonstrate the AIR platform. Here’s what our workbench looks like at the moment:
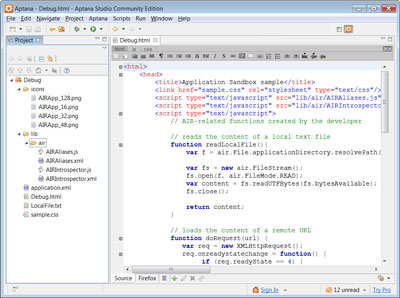
In particular, we now have a Debug.html file (or similar, depending on your project name), complete with JavaScript examples and references to our AIR frameworks.
One of the examples uses the readLocalFile function, so let’s add some debugging notes to that. Update it to add the calls to air.trace, as shown below:
function readLocalFile(){
var f = air.File.applicationDirectory.resolvePath("LocalFile.txt");
air.trace("Opening LocalFile.txt in applicationDirectory");
var fs = new air.FileStream();
fs.open(f, air.FileMode.READ);
var content = fs.readUTFBytes(fs.bytesAvailable);
fs.close();
air.trace("Read contents of LocalFile.txt: " + content);
return content;
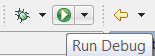
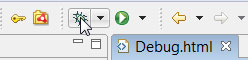
}Save the file, and launch it using the Run Debug button:
Our application window appears:
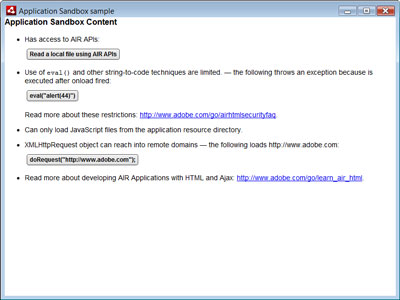
Click the Read a local file using AIR APIs button. The file is read and the alert window appears:
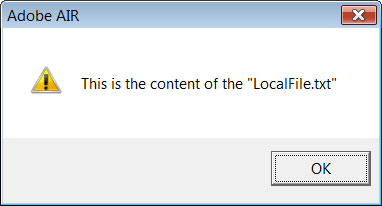
Click OK (or similar, depending on your OS), and head back to Aptana. The Console view should appear below your code window.
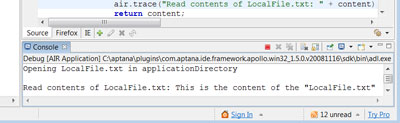
The AIR architecture closely mimics the Flash debugging approach – applications can “trace” messages, which are then sent back to the parent application, typically the AIR Debug Launcher (“ADL”). In this case, Aptana receives these debugging messages and sends them to the Console view.
Of course, dumping text to a console is useful, but what if we want to look inside the script execution, and examine objects? Bring on the AIR HTML Introspector, the Firebug of the AIR world.
Exploring at Runtime
Head back to your open Application Sandbox sample window, and hit F12. The AIR HTML/JS Application Introspector window appears:
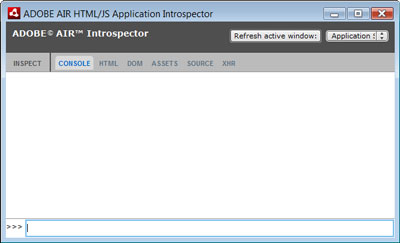
The Introspector includes a JS console, a DOM tree and node inspector, and a look at the source (including parsed source) of files in the AIR project. There’s also an XMLHttpRequest monitor to keep an eye on AJAX requests. Most importantly, the Introspector has an API that we can use right from within our AIR application. Head back to the readLocalFile function we modified earlier, and change it to this:
function readLocalFile(){

  var f = air.File.applicationDirectory.resolvePath("LocalFile.txt");

  air.Introspector.Console.log("Opening LocalFile.txt in applicationDirectory");

  var fs = new air.FileStream();

  fs.open(f, air.FileMode.READ);

  var content = fs.readUTFBytes(fs.bytesAvailable);

  air.Introspector.Console.info(fs);

  fs.close();

  return content;

}
Close the AIR application, save Debug.html, and click the Run button again. When the application opens, click the Read a local file button once more, but watch for the Introspector window – it might be hidden in your dock or taskbar. You might need to hit F12 to find it, and click the Read a local file button once again if the console is empty. Now, the Introspector window has two new entries:
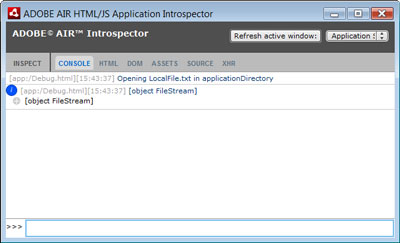
Logging our debug messages to the console is useful, but the Introspector can go one step further: have a look at the [object FileStream] in the console window. This indicates that we’ve sent a FileStream object – sure enough, var fs = new air.FileStream() — to the console. Click the gray plus symbol (+) on the second line to view the object.
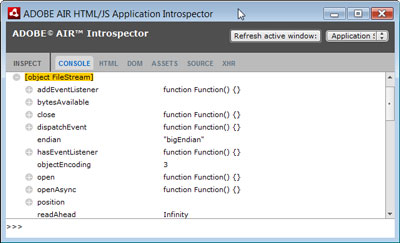
You can inspect objects and manipulate them in real time using the >>> prompt at the bottom of the window. For example, we could choose to keep our file stream open during the script, call a few of the methods of the object from the console (by assigning the object a reference in a global variable), and then run fs.close() manually once we’re done.
So we can keep an eye on the script execution, and even have a peek inside. But what about managing code execution? What if we could simply pause our JavaScript and have a look from the inside out? Let’s have a look at the latest in this update of the Aptana plugin, the debugging platform integration.
Debugging on Wheels
With the AIR 1.5 update and the Aptana Studio 1.2.1 release, Aptana and Adobe have created an amazing debugging platform, taking advantage of the power of Eclipse to give developers more features than ever. Let’s have a look at just how this new platform can help.
Close our sample AIR application and return to the Debug.html editor. The left margin on the editor actually has two columns – one for code folding, one for breakpoints. On line 17, the second air.Introspector.Console line, double-click on the left side of the margin. A blue dot appears:
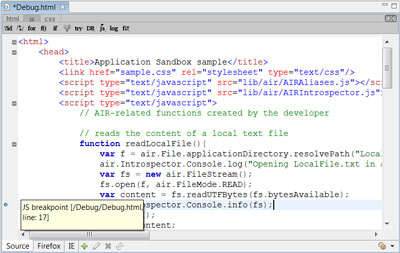
This sets a breakpoint, or a point during which script execution will suspend and allow us some breathing time. Now, save Debug.html and run your application using the Debug button instead of Run:
When the application window opens, click the Read a local file button. This time, the window freezes and Aptana Studio appears with a dialog box:
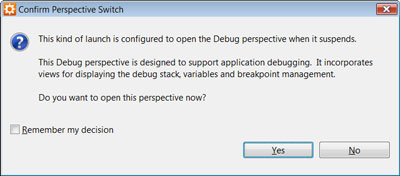
The Debug perspective is a standard feature of the Eclipse debug system, which Aptana has managed to tightly integrate with the Adobe AIR SDK. Click Yes to confirm the perspective switch; the debug perspective is well set up to enable debugging. Aptana will rearrange the workbench till it looks like this:
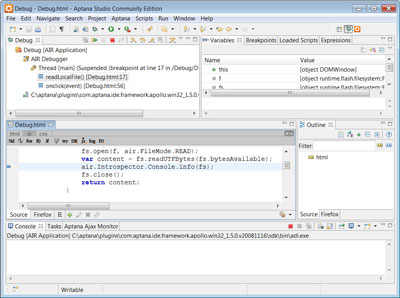
While the debug perspective presents quite a busy interface, you’ll appreciate having this power at your fingertips later. Let’s have a look at the different views in this perspective.
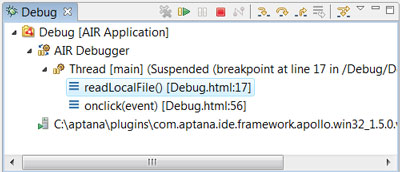
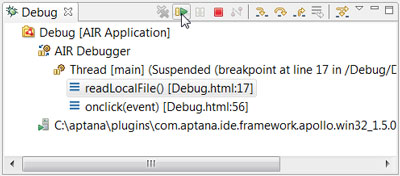
The Debug view (no relation to our project name) provides a basic stack and control panel for script execution. Here, it lists the AIR Debugger control, which manages the script execution thread, as well as the AIR Debug Launcher (ADL) server. Clicking any of the entries in the stack trace will navigate the open editor panel to the correct file and line, helping you quickly walk through code.
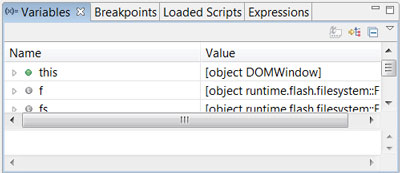
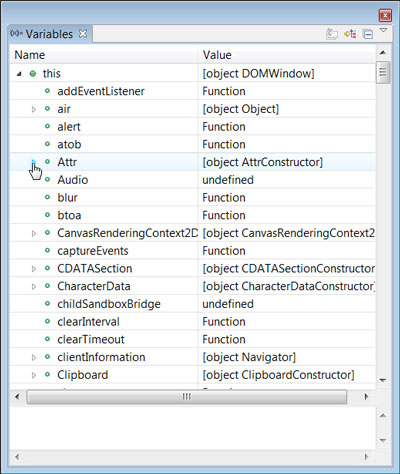
The Variables view will display any variables and objects in the current scope. Similar to the AIR Introspector, you can use this to inspect objects. Notice variables inside our readLocalFile function, including our FileStream object from earlier, are included. As they’re standard JavaScript objects, you can freely open them up and examine their internals.
Docking this view fails to do it justice. Right-click on the Variables title tab, click Detached, and resize the resulting window as you see fit. (Alternatively, you can dock it to the side of the workbench, in return for horizontal screen real estate.) Much better.
(You can always find this view again using Window > Show View or Alt + Shift + Q – V)
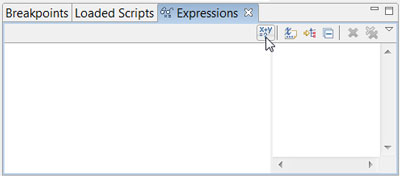
Expressions is next. Similar to Variables, Expressions allows you to watch the value of an expression in real time. This could be a simple variable, or it could be a function call. For example, I often use the Expressions view to check DOM nodes on a page matching a certain CSS selector while jQuery is loaded. To use the Expressions view, add Watch Expressions using the first button in the mini toolbar.
Let’s create a Watch Expression. But first, let’s resume the script execution: hit the Resume button back on the Debug view.
The alert box reporting This is the content of LocalFile.txt will appear, but it may be hidden under your Aptana window. Seek it out and hit the OK button, or your AIR application will object. Our AIR application is now back in action, and the Debug view will report a “Thread [main] (Running)“; we’re now ready to add an expression. Try a simple one, like window.innerHeight, and explore the result.
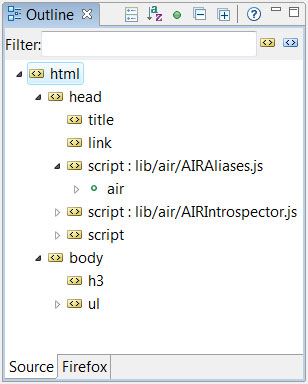
We have an excellent set of tools to debug our JavaScript, but what about our HTML itself? This is where the Outline view comes in. Using the Outline panel, you can inspect the structure of DOM nodes that make up your page. You can even look inside certain nodes, and inspect JavaScript objects defined or referenced in script tags. Similarly, the Loaded Scripts view shows defined functions on a file-by-file basis.
Finally, we have the usual Console view. If we use the AIR trace debugging approach instead of the Introspector, we can send output to the console. This is even exposed to the Flash Player runtime when evaluating expressions, so you can create a complex expression with an embedded function and send some output to the console. Debug while you debug!
Final Thoughts
AIR debugging has come of age. The AIR toolchain in Aptana is extremely versatile, and even serves as a fantastic debugging environment for standard web pages, courtesy of the full-fledged JavaScript engine and WebKit renderer built in to the AIR platform. The new debugging platform is just as powerful as the Flex debugging system included in Flex Builder 3; it rounds off AIR as a powerful web-based platform, a demonstration of the power of JavaScript, and a must-see for all web developers.
In the mean time, test yourself on the contents of this article by taking the quiz. The first 200 people to submit their answers will receive a print copy of The Adobe Flash Platform ActionScript Reference for Rich Internet Application Development, delivered to their door for free, courtesy of Adobe. Take the quiz now!
Frequently Asked Questions (FAQs) about Debugging Adobe AIR Application
How can I install the Adobe AIR debugger?
The Adobe AIR debugger is a tool that helps developers to identify and fix issues in their applications. To install it, you need to download the Adobe AIR SDK from the official Adobe website. Once downloaded, extract the files and locate the “bin” folder. Inside this folder, you will find the AIR Debug Launcher (ADL), which is the main tool used for debugging Adobe AIR applications. To use it, you need to open a command prompt, navigate to the “bin” folder, and then run the ADL with the appropriate parameters.
What are the common issues that can be identified using the Adobe AIR debugger?
The Adobe AIR debugger can help identify a wide range of issues in your applications. These include runtime errors, logic errors, and performance issues. Runtime errors are problems that occur while your application is running, such as null pointer exceptions or type errors. Logic errors are mistakes in your code that cause it to behave incorrectly, such as incorrect calculations or loops that never end. Performance issues are problems that cause your application to run slowly or inefficiently, such as memory leaks or inefficient algorithms.
How can I use the Adobe AIR debugger to identify runtime errors?
To identify runtime errors using the Adobe AIR debugger, you need to run your application with the debugger attached. When a runtime error occurs, the debugger will pause execution of your application and highlight the line of code where the error occurred. You can then inspect the values of variables and expressions at the time of the error to help determine what caused it.
How can I use the Adobe AIR debugger to identify logic errors?
Identifying logic errors with the Adobe AIR debugger involves setting breakpoints in your code where you suspect the error might be. When your application hits a breakpoint, it will pause, allowing you to step through your code one line at a time and inspect the values of variables and expressions. This can help you understand the flow of your code and identify where it is behaving unexpectedly.
How can I use the Adobe AIR debugger to identify performance issues?
The Adobe AIR debugger includes a profiler that can help identify performance issues. The profiler records how long each function in your code takes to execute and how much memory it uses. By analyzing this data, you can identify functions that are taking longer than expected or using more memory than necessary, which can help you optimize your code for better performance.
Can I use the Adobe AIR debugger with other Adobe products?
Yes, the Adobe AIR debugger can be used with other Adobe products that support AIR applications, such as Flash Builder and Animate. These tools provide additional features for debugging, such as a visual interface for setting breakpoints and inspecting variables, and integration with the AIR debugger for testing and debugging your applications.
How can I learn more about using the Adobe AIR debugger?
The official Adobe website provides comprehensive documentation on the Adobe AIR debugger, including a detailed guide on how to use it and a reference for all the commands and options it supports. Additionally, there are many online tutorials and forums where you can learn from other developers’ experiences and ask questions.
What are the system requirements for the Adobe AIR debugger?
The Adobe AIR debugger is part of the Adobe AIR SDK, which is available for Windows, macOS, and Linux. The system requirements for each platform are listed on the official Adobe website. Generally, you will need a recent version of the operating system, a compatible version of the Java Development Kit (JDK), and enough disk space to install the SDK and your AIR applications.
Can I use the Adobe AIR debugger to debug mobile applications?
Yes, the Adobe AIR debugger can be used to debug AIR applications running on mobile devices. You can connect your device to your computer via USB and then use the debugger to test and debug your application directly on the device. This can be very useful for identifying issues that only occur on specific devices or operating systems.
Is the Adobe AIR debugger free to use?
Yes, the Adobe AIR debugger is included with the Adobe AIR SDK, which is free to download and use. However, some Adobe products that integrate with the AIR debugger, such as Flash Builder, are commercial products and require a license to use.

