

Key Takeaways
- Quartz 2D is a powerful Apple graphics API that allows for custom, high-quality graphic rendering directly within iOS applications.
- The flexibility of Quartz 2D enables developers to meet specific design requirements such as custom backgrounds and smooth scrolling, which third-party libraries may not support.
- Setting up a project for Quartz 2D involves creating a new Xcode project, adding a UIScrollView, and customizing a UIView to serve as the graph view.
- Drawing with Quartz 2D involves defining constants for graph dimensions and attributes, then implementing drawing in the `drawRect:` method of a UIView subclass.
- Quartz 2D supports detailed customization of graphical elements, such as line color, thickness, and pattern, allowing for the creation of both simple and complex graphical representations.
When I joined the team I have been working with recently, they were trying to create a graph using Core Plot, a popular third party library. It didn’t go well though, there were two big problems. First, they couldn’t use a custom image for the graph’s background, as was required by the designer. Second, the quality of scrolling was unacceptable.
By that time, I already had a couple of graphs under my belt, so I suggested an alternative approach: to draw the graph from scratch using nothing else but Quartz 2D – a graphics rendering API created by Apple, a part of the Core Graphics.
At first, this solution didn’t seem optimal. After all, many third party libraries were created to shield developers from using low level APIs, to save our time and effort. However, working with Quartz 2D isn’t that hard. You just need to know how to do certain things, and once you’ve learnt them, you can move forward quite quickly. I spent just a couple of weeks creating a sophisticated solution that implemented every little wish of the designer.
In this series of articles, I am going to share with you the approach I am using for drawing graphs. Let’s put together some requirements for our future solution.
- It should scroll smoothly, and easily resize for different datasets.
- It should respond to touch by displaying an appropriate information.
- It should look well and be flexible enough to make our designers happy.
Creating the Project
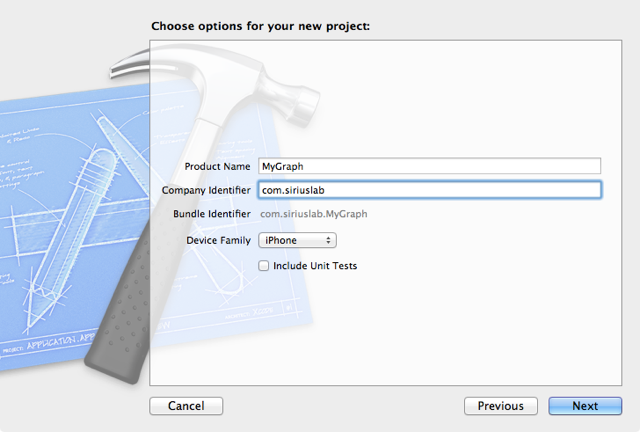
We need to create an Xcode project that will host our gradually emerging graph. The View-based Application template will work just fine, and you can give the project any name you find appropriate. I named it MyGraph.
After the template project is generated and saved to a location of your choice, our first task is to create a simple user interface. Let’s create a graph that occupies the whole view in landscape orientation, but only the upper part of the view in portrait orientation.
We can decide later to use the lower part of the portrait view for some controls, or for displaying our data as a table. The important requirement is that the graph should scroll in whatever the amount of space is given to it.
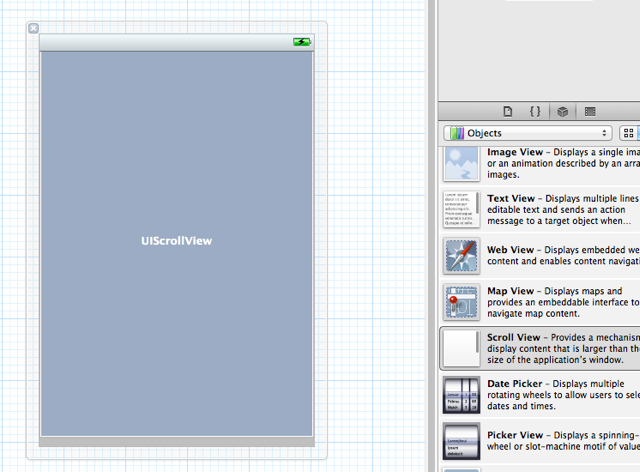
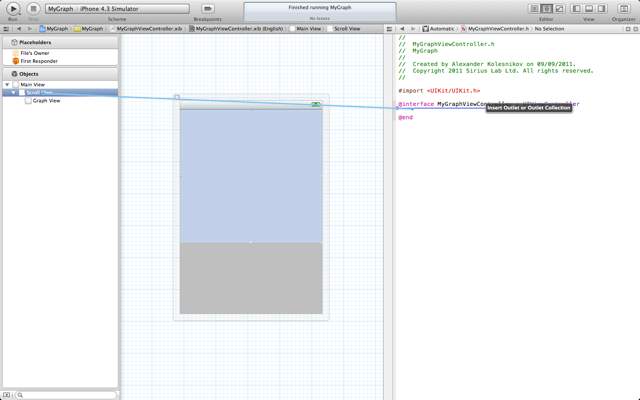
In Xcode, select the MyGraphViewController.xib file. In the Library, find the Scroll View and drag and drop an instance of it to the main view. With any luck it should snap into place, see the below image to check your progress.
Resize the UIScrollView so that it occupied the top part of the portrait view and make its height 300 pixels. That’s the height of the landscape view (320 pixels) minus the status bar. Also disable a couple of autosizing handles so that the scroll view resized properly with the change of orientation:

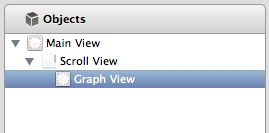
For drawing, we are going to use a simple view or, to be precise, a subclass of UIView class. In the Library, find View, then drag and drop one right on top of the UIScrollView. Expand the hierarchy of the objects in the MyGraphViewController.xib file and make sure that the newly added view became a child of the Scroll View.
Also notice that I’ve labeled the two views Main View and Graph View appropriately. This is very easy to do – just press Enter with the view is selected in the hierarchy and give it a new name – but can become incredibly convenient as the number of views in the graph grows.
We’ll want our Graph View to be wide enough, so that it could scroll in the Scroll View, so let’s give it an initial width of 900 pixels, as seen in the image below. This brings the initial setup to completion, and we can start drawing.

Drawing the Grid Lines
We’ll want to start from something simple, something that will just confirm to us that everything is right. A straight line is about the simplest thing one can draw, and most graphs have some sort of grid lines as a visual aid. It would be reasonable then, to start from drawing a bunch of grid lines.
But where exactly we are going to draw? So far, our Graph View is just a stock UIView that draws nothing. What we need is to extend the UIView, and in the new class override the drawRect method: that’s where our drawing code will go.
Add to the project a new Objective-C class, make it a subclass of UIView and give it a descriptive name, say GraphView. Next, select the view that we’ve labeled Graph View in the hierarchy of the MyGraphViewController.xib file and change its class to the new one, GraphView:

In GraphView.m, you will see that the - (void)drawRect:(CGRect)rect method is commented out. Remove the comments and leave the body of the method empty. Before we’ll be able to draw anything, we’ll need to obtain a reference to the graphics context, so let’s add the very first line of code and the method will look like this:
- (void)drawRect:(CGRect)rect
{
    CGContextRef context = UIGraphicsGetCurrentContext();
}
Our drawing code is going to use a lot of numbers – for example, it will need to know the width and the height of the graph. It is a good idea to define all those numbers as constants in the header file GraphView.h. This way, whenever you want to change a value, you’ll be able to find it easily. Switch to GraphView.h and add the following definitions right after the import statement:
#define kGraphHeight 300
#define kDefaultGraphWidth 900
#define kOffsetX 10
#define kStepX 50
#define kGraphBottom 300
#define kGraphTop 0
First, we define two constants for the width and the height of the graph, they correspond to the dimensions of the Graph View in the XIB file. We’ll be changing the width of the graph dynamically, but it’s good to have a default value.
As for kStepX and kOffsetX, they define the horizontal distance between the vertical grid lines and the offset for the first line respectively.
Finally, we define the coordinates for the top and the bottom of the graph. Currently, they are the same as the top and the bottom of the view but we might want to change that with time. (Note that the vertical coordinate starts at the top of the view and increases as we go down.)
We can start drawing now. In Quartz 2D, drawing is done in three steps:
- Preparation. This is where we define which resources and dimensions we are going to use: colors, fonts, dimensions and so on.
- Actual drawing: our code draws lines, curves etc.
- Commit. We need to tell Quartz 2D that we’ve done with this step of drawing and it can make our art visible. If we omit this step, nothing will appear in the view.
Usually, to complete the drawing we need to repeat these three steps multiple times. For the first step, let’s define the thickness and the color of the grid lines. Add the following two lines to the drawRect method:
CGContextSetLineWidth(context, 0.6);
CGContextSetStrokeColorWithColor(context, [[UIColor lightGrayColor] CGColor]);
Next, we’ll do the actual drawing of as many vertical lines as can fit in our view:
// How many lines?
int howMany = (kDefaultGraphWidth - kOffsetX) / kStepX;

// Here the lines go
for (int i = 0; i < howMany; i++)
{
    CGContextMoveToPoint(context, kOffsetX + i * kStepX, kGraphTop);
    CGContextAddLineToPoint(context, kOffsetX + i * kStepX, kGraphBottom);
}
Thanks to the descriptive names of Core Graphics functions and our constants, I don’t think there is a need to explain what this code does. Finally, we commit our drawing, and this is the required third step:
CGContextStrokePath(context);
Here is the complete code of the drawRect method at this point:
- (void)drawRect:(CGRect)rect
{
    CGContextRef context = UIGraphicsGetCurrentContext();

    CGContextSetLineWidth(context, 0.6);
    CGContextSetStrokeColorWithColor(context, [[UIColor lightGrayColor] CGColor]);

    // How many lines?
    int howMany = (kDefaultGraphWidth - kOffsetX) / kStepX;

    // Here the lines go
    for (int i = 0; i < howMany; i++)
    {
        CGContextMoveToPoint(context, kOffsetX + i * kStepX, kGraphTop);
        CGContextAddLineToPoint(context, kOffsetX + i * kStepX, kGraphBottom);
    }

    CGContextStrokePath(context);
}
Further on, I won’t show the complete code anymore as it will be getting longer and longer. Basically, whatever we’ll be adding after this, will always go to the bottom of the method, unless specified otherwise. If you want to see the completed version, you are welcome to checkout the Github BuildMobile Quartz 2D Graph repository.
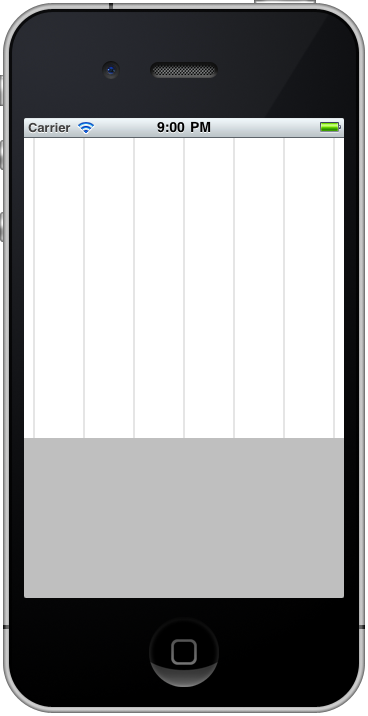
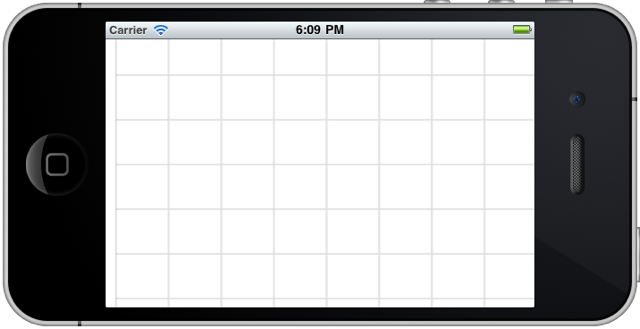
Run the application, and you should see the vertical gray lines in the graph view.
However, when we turn the device to the landscape orientation, the graph doesn’t follow the rotation. We should explicitly declare that we do support change of orientation. In MyGraphViewController.m, change the shouldAutorotateToInterfaceOrientation method so that it looked like this.
- (BOOL)shouldAutorotateToInterfaceOrientation:(UIInterfaceOrientation)interfaceOrientation
{
    return YES;
}
Try to run the app again, and this time the future graph will follow the rotation of the device.

Unfortunately, the graph doesn’t scroll yet. That’s because we need to explicitly tell the UIScrollView what’s the size of its content. And to be able to do that, we need to have a pointer to the UIScrollView.
Enabling Scrolling
In Xcode, select the MyGraphViewController.xib file, make sure that the view hierarchy is visible and press the Show the Assistant editor button in the Editor section of the toolbar. The contents of the MyGraphViewController.h header file should appear in the right half of the split view. Ctrl-drag from the Scroll View in the hierarchy to the source code on the right hand side so that the insertion point was inside the class declaration, as the following screenshot demonstrates:
Release the mouse button, give the new outlet a name, say, scroller, and Xcode will automatically write all the code required to properly obtain a pointer to the Scroll View and maintain it. Here is what the resulting code should look like in MyGraphViewController.h. A few lines of code will be added to MyGraphViewController.m as well.
#import <UIKit/UIKit.h>

@interface MyGraphViewController : UIViewController {
    UIScrollView *scroller;
}

@property (nonatomic, retain) IBOutlet UIScrollView *scroller;

@end
Now, as soon as the app is ready to be displayed, we need to tell the Scroll View what’s the size of its child Graph View. The best place to do that is in the viewDidLoad method of the MyGraphViewController class. This method is probably already present in MyGraphViewController.m but it might be commented out. Remove the comments and add the following line of code:
- (void)viewDidLoad
{
    [super viewDidLoad];

    scroller.contentSize = CGSizeMake(kDefaultGraphWidth, kGraphHeight);
}
Now you can run the app, and the Graph View will scroll nicely, in both portrait and landscape orientation.
Tweaking the Grid Lines
To be honest with you, I decided to draw the grid lines before enabling scrolling so that you could easily notice whether or not the graph needed to be scrolled. Now that the grid lines are there, we might want to tweak them a little bit.
One obvious addition is the horizontal grid lines. That’s easy. First add a couple of new constant definitions to GraphView.h
#define kStepY 50
#define kOffsetY 10
Then add the following lines of code right after drawing the vertical grid lines, before the line that commits the drawing.
int howManyHorizontal = (kGraphBottom - kGraphTop - kOffsetY) / kStepY;
for (int i = 0; i <= howManyHorizontal; i++)
{
    CGContextMoveToPoint(context, kOffsetX, kGraphBottom - kOffsetY - i * kStepY);
    CGContextAddLineToPoint(context, kDefaultGraphWidth, kGraphBottom - kOffsetY - i * kStepY);
}
If you run the application, you will see both the vertical and the horizontal grid lines.
In many cases, this kind of grid line will be good enough, but your designers might not be happy until you make the lines dashed. Thankfully, we can do that easily by simply adding a couple of lines of code to the preparation step. Right underneath the line that sets the stroke color, add the following code.
CGFloat dash[] = {2.0, 2.0};
CGContextSetLineDash(context, 0.0, dash, 2);
The dash array specifies that there are two elements in the pattern: a dash and an empty space after it. The last parameter of the CGContextSetLineDash function, 2, is the number of elements in the dash array. Knowing this, you can experiment with different types of dash patterns to create something that is appropriate for your purposes. If you run this code as it is, you should see the grid lines in the following screenshot.

Any other lines that we are going to draw later won’t be dashed, so we need to disable the dash that we’ve set up before. To do that, insert the following line of code right after the line that commits the drawing.
CGContextSetLineDash(context, 0, NULL, 0); // Remove the dash
Now we’ve prepared everything we might need before actually drawing the graph. The only other enhancement we might want to add is a graphical background for the graph, possibly crafted by our designers.
Adding a Graphical Background
I am not a designer, so the background I’ve created is very simple. The file is named background.png, and you will find it in the code on GitHub. Alternatively, you can create a graphic of your own, it should be 300 pixels tall and 900 pixels wide.
Add the background file to the project. I have created a new group named Artwork and placed the file into this group. Next, we need to insert three lines of code before and grid line drawing was done. Put them after the first line of this method, the one where we obtain a reference to the graphics context:
CGContextRef context = UIGraphicsGetCurrentContext();

// Draw the background image
UIImage *image = [UIImage imageNamed:@"background.png"];
CGRect imageRect = CGRectMake(0, 0, image.size.width, image.size.height);
CGContextDrawImage(context, imageRect, image.CGImage);
...
Run the project, and you will see both the background and the grid lines:

Admittedly, using both a graphical background and grid lines in this particular case looks like an overkill. You might decide to leave either the background or the grid lines, but at least you know how to draw both.
Note: In this particular case, the background is very simple. If it was a more complex drawing, you would notice that it’s being drawn upside down. We’ll learn how to deal with this later in the article, for now let’s just leave it as it is.
Now that all the background work is completed, we can start drawing the actual graph, and this is exactly what we shall do in the next part of the article. Grab the Quartz 2D Graph code from the GitHub Repo and leave us your thoughts and questions in the comments. See you soon.
Quartz 2D Index
Alexander Kolesnikov’s series on Creating a Graph using Quartz 2D was split into 5 parts. You can refer to the series using the Quartz 2D Tag and access the individual articles using the links below.
- Creating a Graph With Quartz 2D: Part 1
- Creating a Graph With Quartz 2D: Part 2
- Creating a Graph With Quartz 2D: Part 3
- Creating a Graph With Quartz 2D: Part 4
- Creating a Graph With Quartz 2D: Part 5
Frequently Asked Questions about Creating a Graph with Quartz 2D
What is Quartz 2D and why is it important in graphics imaging?
Quartz 2D is a powerful, high-level drawing engine provided by Apple for its macOS and iOS platforms. It’s part of the Core Graphics framework, which is used for handling image processing and drawing tasks. Quartz 2D is important in graphics imaging because it provides a wide range of features for creating complex graphics, including support for transparency, gradients, and anti-aliasing. It also supports PDF content, making it a versatile tool for developers working on graphics-intensive applications.
How does Quartz 2D compare to other graphics engines?
Quartz 2D stands out from other graphics engines due to its extensive feature set and its integration with the macOS and iOS platforms. It supports a wide range of image formats, including JPEG, PNG, and TIFF, and it also provides support for PDF content. This makes it a versatile tool for developers working on graphics-intensive applications. Additionally, Quartz 2D’s support for transparency, gradients, and anti-aliasing allows for the creation of complex and visually appealing graphics.
Can I use Quartz 2D for creating 3D graphics?
Quartz 2D, as the name suggests, is primarily designed for 2D graphics. It provides a wide range of features for creating complex 2D graphics, including support for transparency, gradients, and anti-aliasing. However, if you’re looking to create 3D graphics, you might want to consider using a 3D graphics engine like OpenGL or Metal, which are also provided by Apple for its macOS and iOS platforms.
How do I get started with Quartz 2D?
To get started with Quartz 2D, you’ll first need to have a basic understanding of the Swift or Objective-C programming languages, as these are the languages used for developing applications on the macOS and iOS platforms. Once you’re comfortable with one of these languages, you can start learning about the Core Graphics framework and Quartz 2D. Apple provides extensive documentation on these topics, which is a great resource for beginners.
What are some common use cases for Quartz 2D?
Quartz 2D is used in a wide range of applications, from simple graphics tasks to complex image processing. Some common use cases include creating custom views, drawing shapes and paths, rendering text, and handling images and PDF content. It’s also used for creating complex graphics with features like transparency, gradients, and anti-aliasing.
How does Quartz 2D handle colors and color spaces?
Quartz 2D provides extensive support for colors and color spaces. It supports both RGB and CMYK color spaces, and it allows for the creation of custom color spaces. Additionally, Quartz 2D provides a number of functions for manipulating colors, including functions for creating colors, converting between color spaces, and adjusting color components.
Can I use Quartz 2D for creating animations?
While Quartz 2D is primarily designed for static graphics, it can be used in conjunction with other frameworks to create animations. For example, you can use Quartz 2D to draw the individual frames of an animation, and then use the Core Animation framework to animate these frames.
How does Quartz 2D handle transparency?
Quartz 2D provides extensive support for transparency. It allows for the creation of transparent colors, and it provides a number of functions for manipulating the alpha channel of colors. Additionally, Quartz 2D supports blending modes, which can be used to create complex effects with transparency.
What are the performance considerations when using Quartz 2D?
While Quartz 2D is a powerful graphics engine, it’s important to keep performance in mind when using it. Complex graphics tasks can be resource-intensive, so it’s important to optimize your code as much as possible. This might involve using caching to reduce the amount of drawing that needs to be done, or using lower-level APIs for performance-critical tasks.
Can I use Quartz 2D for creating vector graphics?
Yes, Quartz 2D is well-suited for creating vector graphics. It provides a number of functions for drawing shapes and paths, and it supports features like gradients and anti-aliasing, which can be used to create complex vector graphics. Additionally, Quartz 2D’s support for PDF content makes it a great tool for working with vector-based PDF files.

