

They say that a picture is worth a thousand words, and nowhere is this more evident than in the use of bar charts.
With bar charts, it’s possible to visualize past sales history, forecast stock prices, and display survey results pictorially — among literally thousands of other applications. Bar charts become even more valuable when they can be generated dynamically. Thankfully, ASP.NET provides the means for doing just that within the existing .NET framework, via the SYSTEM.DRAWING namespace.
In this tutorial, we’ll:
- Examine some of the classes and methods of the
SYSTEM.DRAWINGnamespace. - Learn how to determine the coordinates of an object.
- Examine the code that’s used to dynamically generate a bar chart like the one shown below.
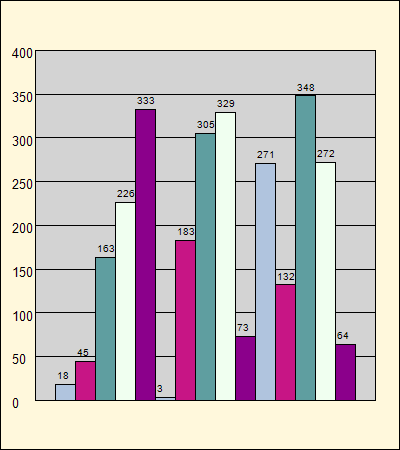
You might be interested to know that the above image file was made using the code we’ll explore in this tutorial, with one slight modification. More on that later.
Before we begin, you might like to download the code that we’ll use in this article.
Key Takeaways
- ASP.NET’s SYSTEM.DRAWING namespace is essential for creating dynamic bar charts, offering a variety of classes and methods to manipulate graphics.
- Understanding object coordinates in the SYSTEM.DRAWING namespace is crucial, with the origin at the upper left corner and zero-based positioning.
- Dynamic bar charts enhance data visualization, making it easier to interpret complex data sets such as sales history or survey results.
- The tutorial provides a step-by-step guide on using SYSTEM.DRAWING tools to configure and customize bar charts, including setting dimensions, drawing shapes, and adding labels.
- The skills learned in manipulating the SYSTEM.DRAWING namespace can be applied to creating other types of charts and graphics, enhancing the visual appeal and functionality of ASP.NET applications.
The System.Drawing Namespace
The SYSTEM.DRAWING namespace provides access to basic graphics functionality that allows us to draw dynamic images, and is the basis on which we’ll build our bar chart. We’ll use the following classes:
Bitmap– This class is used to create the bitmap image.Graphics– This is the surface that contains all the individual objects that comprise our bar chart.SolidBrush– This class defines a brush of a single color. Brushes are used to fill graphical shapes, which, in the case of our bar chart, will be rectangles.Pen– Pen defines an object that’s used to draw lines and curves.
We’ll also use a number of methods within the SYSTEM.DRAWING namespace:
Clear– This method clears the entire drawing surface and fills it with the specified background color. Its only parameter is the Color object, which specifies the color that we want to paint the background.FillRectangle– This method uses a brush to fill the interior of a shape. This is the method we’ll use to color-fill the background color of our bitmap, the background of the chart area, and the chart bars. The parameters it uses are brush, the X and Y coordinates of the upper left corner of the rectangle, and the width and height of the rectangle.DrawRectangle– This is the method with which we’ll draw a border around the bitmap, bar chart area, and the chart bars. The parameters it uses are brush, the X and Y coordinates of the upper left corner of the rectangle, and the width and height of the rectangle.DrawLine– This method is used to draw the horizontal scale lines. The parameters it uses are the pen that was used to draw the line, the X and Y coordinates of the line’s starting point, and the X and Y coordinates of the line’s end point.DrawString– This method draws text objects on our image. The parameters it uses are the text string that we want to draw, font information, the brush it uses, and the X and Y coordinates of the upper left corner of the drawn text.
Determining the Coordinates of an Object
Determining the X and Y coordinates that position each of the objects in our image is a topic that deserves special attention, since it has the potential to cause the biggest problems in our drawing. Unlike the information you may recall from your high school geometry class, the home coordinate — or (0,0) position — in .NET is actually located in the upper left corner of the display. Furthermore, position plotting is zero-based; that is, a rectangle that’s 200 pixels wide and 400 pixels high, for example, will have X coordinates that range from 0 to 199, and Y coordinates that range from 0 to 399.
Take a look at the image below, which shows the coordinates of each corner in our 200 x 400 rectangle.
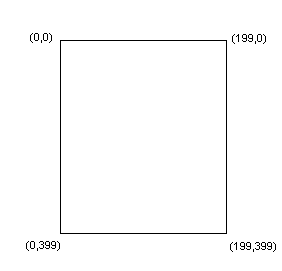
Now, if we wanted to draw a line from the lower left corner of our rectangle to the lower right corner, we would plot two points: (0,399) and (199,399). This information will be useful when we determine the coordinates and dimensions of the shapes that comprise our chart.
The Code to Generate our Bar Chart Image
We designed all the dimension and positioning constants in a way that would allow the proportion and scale of our drawing to change as those values change. For example, the height and width are set to 450 and 400, respectively, in our sample program. If we were to change those values to, say, 850 and 1125 respectively, the height and width of our bars would change, as would the other elements in our chart.
Before we dive into the code, let’s examine the global values it uses:
BMP_HEIGHTandBMP_WIDTHare the dimensions of the bitmap image.CHART_LEFT_MARGIN,CHART_RIGHT_MARGIN,CHART_TOP_MARGINandCHART_BOTTOM_MARGINdefine the margins between the outside border of our bitmap and the border around the chart area.CHART_HEIGHTandCHART_WIDTHare the dimensions of the chart area.SCALE_INCREMENTprovides the increment of horizontal scale lines on the bar chart.BAR_LABEL_SPACErepresents the amount of space, in pixels, between the top of each bar on the chart, and each bar’s label.LINE_COLORis the constant object that defines the color of lines and borders around various objects.TEXT_COLORis a constant object that defines the text color for the horizontal scale labels and bar value labels.barValueis an integer array that contains the values of the bars that are drawn on the bar chart.bitmapis a class that’s used to create the bitmap image.chartis the graphics class that’s associated with our bitmap image. It represents the surface onto which all the objects of our bitmap will be placed.
Now, on to the code! In some cases, the code in this tutorial has been formatted differently than the download code, so that it can conform to web display requirements.
Dim bitmap As New Bitmap(BMP_WIDTH, BMP_HEIGHT)Create an instance of our Bitmap class and set its dimension to the constants, BMP_WIDTH and BMP_HEIGHT.
Dim Chart As Graphics = Graphics.FromImage(Bitmap)Create an instance of the Graphics class that’s associated with our Bitmap image. This is the surface onto which all other objects for our bitmap will be placed.
barValueis an integer array that will be used in drawing the chart bars, and is populated via theGetBarValues()function (below):
Function GetBarValues()

  barValue = New Integer() {18, 45, 163, 226, 333, _

                                3, 183, 305, 329, 73, _

                                271, 132, 348, 272, 64}

        Return barValue

    End Function
Note that these values are hard-coded for the sake of keeping our code as simple as possible. However, they could just as easily be replaced with database data, form data, or data passed into our program via query string.
The next section of code comprises a series of variables that are used to define the dimensions and locations of certain objects on the chart.
numberOfBars = barValue.LengthnumberOfBarsis the size of the integer array containing the bar values. Its main use is in determining the width of the chart bars. I could just as easily reference thebarValuearray length directly using its definition,barValue.Length. However, this variable is used to help our understanding of the code.
highBarValue is the highest bar value that appears on the chart, and is defined by the following function:
 Public Function GetHighBarValue(ByVal numberOfBars As Integer, _

                            ByVal barValue As Integer(), _

                            ByVal highBarValue As Integer)


        Dim i As Integer


        For i = 0 To numberOfBars - 1

            If barValue(i) > highBarValue Then

                highBarValue = barValue(i)

            End If

        Next


        Return highBarValue

End Function
This function loops through the bar value integer array and sets the highBarValue variable to the highest value in the array.
maximumScaleValueis the highest scale value along the Y axis, and is defined by the functionGetMaximumScaleValue. Let's examine each of the statements in this function.
maximumScaleValue = Math.Ceiling(highBarValue / scaleIncrement) * scaleIncrementThis statement calculates the highest multiple of the scale increment for the chart. In our example, the scale increment is 50 and the highest bar value is 348. Therefore, the maximum scale value is 350.
 If (maximumScaleValue - highBarValue) < BAR_LABEL_SPACE Then

        maximumScaleValue += scaleIncrement

  End If
If the highest bar is too close to the top of the chart, its label will sit above the chart area of our bitmap. To prevent this from happening, we’ll need to increase the maximum scale value by one additional scale increment. Going back to our sample chart again, we recall that the maximum scale value was calculated as 350. Our high bar value is 348, which is only 2 points away from the top of the chart area. We want the top bar value to be at least 15 points (the value of BAR_LABEL_SPACE) from the top of the chart, so we need to increase the maximum scale value from 350 to 400:
numberOfHorizontalScaleLines = maximumScaleValue / SCALE_INCREMENTThe number of horizontal scale lines is used as an index when the scale lines are drawn on the chart. To define it, we divide the maximum scale value by the scale increment. The total number of scale lines is also used to calculate the vertical scale ratio, which is discussed next.
verticalScaleRatio = CHART_HEIGHT / numberOfHorizontalScaleLinesverticalScaleRatiois the factor that ensures that the vertical positioning of the horizontal scale lines is proportional to the height, in pixels, of the chart area.verticalScaleRatiois calculated by dividing the chart's height by the number of horizontal scale lines in the chart.In our sample program, the chart height is 350 pixels, and it has 8 horizontal scale lines. Thus, the vertical scale ratio is:
350 / 8
or 43.75 pixels. This means that we need to draw horizontal scale lines every 43.75 pixels from the top to bottom of the bar chart.
barHeightRatio = CHART_HEIGHT / maximumScaleValueIn a similar manner to the way in which we calculated the vertical scale ratio for placement of the horizontal scale lines, we need also to calculate the bar height ratio so that the height in pixels of each bar is proportional to the chart’s height.
In our example, the bar height ratio is calculated as follows:
350 / 400 = 0.875.
Thus, each bar value will be multiplied by a factor of 0.875.
Next, let’s examine the methods that draw the chart elements.
DrawChartBackground
The following color structures are defined for this method:
clearCanvasis the base color of the bitmap image.bmpBackgroundColoris the background color of the bitmap image.chartBackgroundColoris the background color of the chart area. It represents the area onto which the chart bars and their labels will be placed.
Chart.Clear(clearCanvas)The above method clears the entire drawing surface and fills it with the color specified by the color clearCanvas.
Chart.FillRectangle(bmpBackGroundColor, 0, 0, BMP_WIDTH, BMP_HEIGHT)This method sets the background color of the bitmap and establishes the chart’s width and height.
Chart.DrawRectangle(LINE_COLOR, 0, 0, BMP_WIDTH - 1, BMP_HEIGHT - 1)
The above method draws a border around the entire bitmap.
chart.FillRectangle(chartBackgroundColor, _

                            CHART_LEFT_MARGIN, _

                            CHART_TOP_MARGIN, _

                            CHART_WIDTH, _

                            CHART_HEIGHT)


chart.DrawRectangle(LINE_COLOR, _

                            CHART_LEFT_MARGIN, _

                            CHART_TOP_MARGIN, _

                            CHART_WIDTH, _

                            CHART_HEIGHT)
The code presented here color-fills, and draws a border around, the chart area of our bitmap. Since all the elements of our bitmap must fit inside the outermost bitmap dimensions, we need to make room within the bitmap for the elements outside of the chart area. Our example displays only scale numbers in this area; however, you may wish to add other elements as you customize the code to suit your needs.
DrawScaleElements
The following constants are defined for this method:
SCALE_Xis the X coordinate of the scale label.SCALE_Xis defined as 25, which is used to locate the X coordinate 25 pixels to the left of the chart’s left margin.SCALE_Yis the Y coordinate of the scale label at the top of the chart. It is defined as 5 pixels below the chart’s top margin, which ensures that the scale labels are centered vertically with respect to the horizontal scale line.iis the index variable that tracks our iterations through the loop.
For i = 1 To numberOfHorizontalScaleLines - 1

            chart.DrawLine(LINE_COLOR, _

                CHART_LEFT_MARGIN, _

                CHART_TOP_MARGIN + (i * verticalScaleRatio), _

                CHART_LEFT_MARGIN + CHART_WIDTH, _

                CHART_TOP_MARGIN + (i * verticalScaleRatio))

Next
This loop draws the horizontal scale lines. Note that, here, we’re drawing only the interior scale lines, as the top and bottom lines were created when we drew our border around the chart area. The starting X coordinate represents the chart’s left margin; the ending X coordinate is derived from a formula that calculates the position of the right-hand side of the chart area. The starting and ending Y coordinates are both the same, and are calculated on the basis of the distance between the chart’s top margin and the current scale line.
For i = 0 To numberOfHorizontalScaleLines

            chart.DrawString(maximumScaleValue - (i * SCALE_INCREMENT), _

                New Font("arial", FontSize.Large, FontStyle.Regular), _

                TEXT_COLOR, _

                SCALE_X, _

                SCALE_Y + (i * verticalScaleRatio))

Next
This loop draws the scale labels. The Y coordinate of the scale label is calculated similarly to the way that we calculated the scale lines’ positioning.
DrawChartBars
This method uses the following elements:
columnSpacingis the variable that’s used to increment the horizontal spacing between each bar on the chart.currentBarHeightis the adjusted value, in pixels, of each individual bar, so that each bar is proportional to the height of the chart (see the previous discussion on this point).barWidthis calculated on the basis of the chart’s width and the number of bars it’s intended to display.fillColoris an array ofSolidBrushobjects that’s used to define the bar colors.numberOfFillColorsdefines the number of array elements in thefillColorarray. It’s used as a counter to determine which color each bar should take.iandjare index variables.
columnSpacing = barWidthThis statement initializes the column spacing before the chart’s bars are drawn.
For i = 0 To numberOfBars - 1


      currentBarHeight = Convert.ToSingle(barValue(i)) * barHeightRatio


     chart.FillRectangle(fillColor(j), _

                columnSpacing + CHART_LEFT_MARGIN, _

                BMP_HEIGHT - CHART_BOTTOM_MARGIN - currentBarHeight, _

                barWidth, _

                currentBarHeight)


     chart.DrawRectangle(LINE_COLOR, _

                columnSpacing + CHART_LEFT_MARGIN, _

                BMP_HEIGHT - CHART_BOTTOM_MARGIN - currentBarHeight, _

                barWidth, _

                currentBarHeight)


   chart.DrawString(Convert.ToString(barValue(i)), _

                New Font("arial", FontSize.Small, FontStyle.Regular), _

                TEXT_COLOR, _

                columnSpacing + CHART_LEFT_MARGIN, _

                BMP_HEIGHT - CHART_BOTTOM_MARGIN - currentBarHeight _

                                       - BAR_LABEL_SPACE)


   j += 1

   If j > (numberOfFillColors - 1) Then

         j = 0

   End If


   columnSpacing += barWidth


Next
This loop formats the chart bars. Let’s examine each statement individually.
currentBarHeight = Convert.ToSingle(barValue(i)) * barHeightRatioThis statement sets the current bar height so that it’s proportional to the height of the chart. (See the previous discussion on bar height ratio for more on this point.)
chart.FillRectangle(fillColor(j), _

                columnSpacing + CHART_LEFT_MARGIN, _

                BMP_HEIGHT - CHART_BOTTOM_MARGIN - currentBarHeight, _

                barWidth, _

                currentBarHeight)
This section fills the bar with the appropriate fill color. The X coordinate of the bar’s upper left corner is calculated as the sum of columnSpacing and CHART_LEFT_MARGIN. The Y coordinate is calculated by starting from the bottom of the bitmap, and subtracting from the Y coordinate value the chart’s bottom margin and the current bar’s height.
chart.DrawRectangle(LINE_COLOR, _

                columnSpacing + CHART_LEFT_MARGIN, _

                BMP_HEIGHT - CHART_BOTTOM_MARGIN - currentBarHeight, _

                barWidth, _

                currentBarHeight)
This code draws the border around the chart bar. This method uses the same calculations as the FillRectangle method we used for the X and Y coordinates of the upper left corner of the bar.
chart.DrawString(Convert.ToString(barValue(i)), _

                New Font("arial", FontSize.Small, FontStyle.Regular), _

                TEXT_COLOR, _

                columnSpacing + CHART_LEFT_MARGIN, _

                BMP_HEIGHT - CHART_BOTTOM_MARGIN - currentBarHeight _

                                       - BAR_LABEL_SPACE)
Draw the label above the bar. The X coordinate in this method is identical to the DrawRectangle method from the previous statement. The Y coordinate is also similar to the DrawRectangle method above, except that it also subtracts BAR_LABEL_SPACE from the calculation so that the label will sit above the bar.
j += 1

If j > (numberOfFillColors - 1) Then

       j = 0

End If
This code block ensures that the bar fill colors are repeated.
columnSpacing += barWidthFinally, this statement increments the columnSpacing variable so that the next bar is positioned alongside the previous one.
The Finishing Touches
Response.ClearContent()This method clears all the content from the output buffer. This code ensures that the only output that’s sent to the browser is our image.
Response.ContentType = "image/gif"

bitmap.Save(Response.OutputStream, Imaging.ImageFormat.Gif)
The first of these statements sets our image type to .gif. The second statement sends our image directly to the browser. If we wanted to send our image to a file instead of to the browser, we’d use the following code:
Response.ContentType = "image/png"

bitmap.Save("C:pathtobargraph.png", Imaging.ImageFormat.Png)
You’ll need to change the value of "C:pathtobargraph.png" to reflect the desired filename and path for your file. Note that when we run our page with these two statements, instead of the previous two, a blank page will display. However, if you look into the directory in which you specified the file to be saved, you’ll find the image has been created as a file that you can open in your favorite graphics software.
chart.Dispose()

bitmap.Dispose()
This last snippet releases the memory used by the Graphics object and the bitmap.
Summary
In this tutorial, we examined some of the classes and methods that are available within the SYSTEM.DRAWING namespace, learned how to determine the coordinates of an object, and used these skills to draw a basic bar chart.
So, where do we go from here? With the skills you’ve acquired from this tutorial, you can easily add a report title, x-axis labels, and a legend to our sample chart. The SYSTEM.DRAWING namespace offers a number of methods that will enable you to create a range of other charts — a pie chart is just one example. Using the advanced two-dimensional graphics functionality of the SYSTEM.DRAWING.DRAWING2D namespace, you can create charts with stunning visual appeal. I would encourage you to examine all the available namespaces and methods, see what they can do for you, then really let your creative juices flow!
Frequently Asked Questions (FAQs) about ASP.NET Graphs
How can I create a basic chart in ASP.NET?
Creating a basic chart in ASP.NET involves a few steps. First, you need to add a Chart control to your page. This can be done by dragging and dropping the Chart control from the toolbox to your page. Next, you need to bind data to your chart. This can be done by setting the DataSource property of the Chart control to your data source. Finally, you need to configure the chart to display the data in the way you want. This can be done by setting various properties of the Chart control, such as the ChartType, XValueMember, and YValueMembers properties.
What types of charts can I create with ASP.NET?
ASP.NET supports a wide variety of chart types, including bar charts, line charts, pie charts, area charts, and more. The type of chart you choose to create will depend on the data you are working with and the way you want to present that data. For example, a bar chart might be appropriate for comparing quantities, while a line chart might be better for showing trends over time.
How can I customize the appearance of my chart in ASP.NET?
ASP.NET provides a number of ways to customize the appearance of your chart. You can change the color and style of the chart elements, add labels and legends, adjust the scale and axes, and more. These customizations can be done through the properties of the Chart control, or by using the Chart Wizard in Visual Studio.
How can I display data from a database in my ASP.NET chart?
To display data from a database in your ASP.NET chart, you need to bind the chart to a data source that represents the database data. This can be done by setting the DataSource property of the Chart control to an instance of a class that implements the IEnumerable interface, such as a DataTable or a List of objects.
Can I create interactive charts with ASP.NET?
Yes, you can create interactive charts with ASP.NET. This can be done by adding event handlers to the Chart control that respond to user actions, such as clicking or hovering over a chart element. For example, you could create a chart that displays additional information when the user hovers over a data point.
How can I export my ASP.NET chart to an image file?
ASP.NET provides a method called SaveImage that allows you to save your chart to an image file. This method takes two parameters: the file name and the image format. The image format can be one of the values of the ChartImageFormat enumeration, such as Jpeg, Png, or Bmp.
How can I add multiple series to my ASP.NET chart?
To add multiple series to your ASP.NET chart, you need to add multiple Series objects to the Series collection of the Chart control. Each Series object represents a set of data points that are displayed as a separate line, bar, or other chart element.
How can I handle large amounts of data in my ASP.NET chart?
Handling large amounts of data in an ASP.NET chart can be challenging, but there are several strategies you can use. One approach is to aggregate the data before displaying it in the chart, reducing the number of data points. Another approach is to use a scrolling or zooming feature, allowing the user to navigate through the data.
Can I use ASP.NET charts in a mobile application?
Yes, you can use ASP.NET charts in a mobile application. However, keep in mind that the display size and interaction methods of mobile devices are different from those of desktop computers, so you may need to adjust the design of your charts accordingly.
How can I debug problems with my ASP.NET chart?
Debugging problems with an ASP.NET chart can be done using the debugging tools in Visual Studio. These tools allow you to step through your code, inspect variables, and view error messages. If you are having trouble with the data binding, you can check the data source to make sure it contains the expected data. If you are having trouble with the chart appearance, you can check the chart properties to make sure they are set correctly.

