

Key Takeaways
- Creating artificial extra load on the live site helped Dropbox to quickly address abrupt failures that couldn’t be detected with monitoring. This technique bought them time to come up with solutions.
- Dropbox found it useful to have thousands of custom stats aggregated over thousands of servers graphed. They implemented a solution using memcached, cron, and ganglia, which enabled them to track thousands of stats in near real time.
- Regularly testing potential system failures and failover processes helped to identify and address issues in a controlled manner, rather than during a real crisis. This involved intentionally taking servers off the network to ensure the failover works.
- Keeping everything in UTC internally saved Dropbox from many potential issues. The timezone conversion was only done at the last moment when displaying times to a user.
Scaling from 4K to 40 million at Dropbox
I was in charge of scaling Dropbox for a while, from roughly 4,000 to 40,000,000 users. For most of that time we had one to three people working on the backend. Here are some suggestions on scaling, particularly in a resource-constrained, fast-growing environment that can’t always afford to do things “the right way” i.e. any real-world engineering project!
Run with extra load
One technique we repeatedly used was creating artificial extra load in the live site. For example, we would do a lot more memcached reads than necessary. Then when memcached broke, we could quickly switch off the duplicate queries and have time to come up with a solution. Why not just plan ahead? Because most of the time, it was a very abrupt failure that we couldn’t detect with monitoring. Note that it’s not perfect to just do extra reads because it’s more likely that high write load will cause problems, but writes are hard to simulate (risk of endangering data, not getting a realistic amount of lock contention). In my experience extra reads alone are actually good enough to buy time.
App-specific metrics
Another thing that became increasingly useful while scaling was to have thousands of custom stats aggregated over thousands of servers graphed. Most out-of-the-box monitoring solutions aren’t meant to handle this sort of load, and we wanted a one-line way of adding stats so that we didn’t have to think about whether it costed anything, or fuss around with configuration files just to add a stat (decreasing the friction of testing and monitoring is a big priority). We chose to implement a solution in a combination of memcached, cron, and ganglia. Every time something happened that we wanted graphed, we would store it in a thread-local memory buffer. Every second we’d post that stat to a time-keyed bucket (timestamp mod something) in memcached, and on a central machine, every minute, the buckets in memcached would get cleared out, aggregated, and posted to ganglia. Very scalable, and this made it possible for us to track thousands of stats in near real time. Even stats as fine-grained as “average time to read a memcached key” that happened dozens of times per request performed fine. Of course, when you have thousands of stats it becomes tough to just “look at the graphs” to find anomalies. Here is one summary graph that we found the most useful: 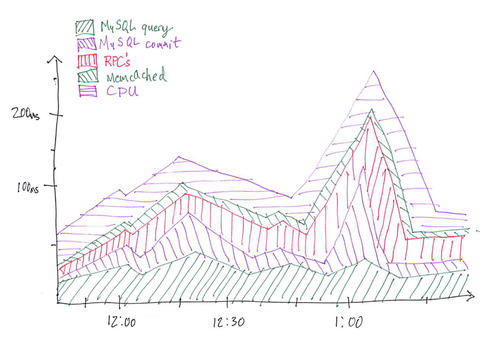
The top line represents average response time on the site (we had one of these graphs for web traffic, and one for client traffic). Each segment represents a partition of work. So you can see there was a spike in response time at around 1:00 which was caused by something in MySQL commit phase. Our actual graph had a bunch more segments, so imagine how much screen real estate this saves when you’re trying to figure shit out. “CPU” is cheating, it’s actually just the average response time minus everything else we factored out. If there is a way to do this, it would also be cool to have markings on the graph that point to events you can annotate such as code push, or AWS outage.
Poor man’s analytics with bash
If you haven’t used the shell much, it can be eye opening how much faster certain tasks are. Let’s say you’re trying to debug something in your webserver, and you want to know if maybe there’s been a spike of activity recently and all you have are the logs. Having graphing for that webserver would be great, but if it’s on 1 or 5 minute intervals like most systems it might not be fine-grained enough (or maybe you only want to look at a certain kind of request, or whatever).
Apr 8 2012 14:33:59 POST ...
Apr 8 2012 14:34:00 GET ...
Apr 8 2012 14:34:01 POST ...
You could use your shell like this:
cut -d’ ’ -f1-4 log.txt | xargs -L1 -I_ date +%s -d_ | uniq -c | (echo “plot ‘-’ using 2:1 with lines”; cat) | gnuplot
Boom!
Very quickly you have a nice graph of what’s going on, and you can tailor it easily (select only one URL, change to a histogram, etc.). Almost all the command line tools take line separated, space delimited 2D arrays as input, with implicit numeric conversions as necessary, so you don’t usually need to do backflips to pipe programs together. They also don’t throw exceptions on bad data, which I think is a good thing when you’re just trying to do something quickly and don’t care about a few dropped data points. If you’re unfamiliar with command line tools, here is a shortlist I’d recommend becoming acquainted with: sed, awk, grep, cut, head, tail, sort, uniq, tr, date, xargs
Log spam is really helpful
Log spam isn’t all that bad. We used to have so many random print statements scattered around the code that would end up in our webserver logs, but I can’t count the number of times it turned out to be unintentionally useful. It’s almost a way of randomly tracing your code. So for example, in debugging a particularly nasty race condition, I noticed that a particular “## your special comment ##” wasn’t getting printed where it should have, and that made it clear where the problem was happening.
If something can fail, make sure it does
If you have something that you know can fail at any point, and you think the failover will be graceful, you should actually test this every so often. Randomly take that server off the network and make sure the failover works, because a couple of things can happen:
- Since the last failover, increased load means the failover process now causes a cascade.
- In between the last failover and now, there have been a bazillion code pushes, database schema changes, internal DNS renames, etc. so any of those scripts that haven’t been run since then might depend on old assumptions.
These things are better to figure out in peacetime, so it’s best to make this stuff happen intentionally. Maybe it sounds stupid to run fire drills on the live site, but testing environments are not sufficient and this is really good insurance.
Run infrequent stuff more often in general
The above points also go for stuff that just doesn’t run all that often in your codebase. If you can afford to push code through the infrequent code paths more often it’ll save some headaches. Like if you have a cron that runs every month, maybe run it as a dry-run every day or week to make sure that at least the assumptions are consistent, so you don’t have to debug it after a month’s worth of commits. Same goes for scripts that are only run manually.
Try to keep things homogeneous
We once long ago had two shards for user data, and once it started getting full I added a third shard to put new users in. Damn, that was a headache! So then we had two shards growing at almost exactly the same pace, and a new one that was growing much faster, meaning we’d have to reshard at different times. It’s much better (but obviously trickier) to just split each shard into two and keep them all looking the same. Homogeneity is good for hardware too, as capacity planning becomes a simpler problem.
Keeping a downtime log
Every time the site goes down or degrades (even short blips), write down the start and end times for the outage and then label it with any applicable causes (bad code review, insufficient monitoring, log overflow). Then when you look at the list you can objectively answer the question “what can I do to minimize the most minutes of downtime right now?” by figuring out how to cover the most minutes. Solutions might span multiple problems and each problem might be solvable many ways, so it helps to write down as much as you can. For instance, proper monitoring might alert you to an impending disk full problem, or you can limit the amount of stuff being written to disk.
UTC
Keep everything in UTC internally! Server times, stuff in the database, etc. This will save lots of headaches, and not just daylight savings time. Some software just doesn’t even handle non-UTC time properly, so don’t do it! We kept a clock on the wall set to UTC. When you want to display times to a user, make the timezone conversion happen at the last second.
Technologies we used
For those that are curious about what we chose and why, the software we used was:
- Python for virtually everything; not more than a couple thousand lines of C
- MySQL
- Paster/Pylons/Cheetah (web framework — minimal use beyond templating and handling form input)
- S3/EC2 for storing and serving file blocks
- memcached in front of the database and for handling inter-server coordination
- ganglia for graphing, with drraw for custom graphs like the stack graph mentioned above
- nginx for the frontend server
- haproxy for load balancing to app servers, after nginx (better configurability than nginx’s balancing modules)
- nagios for internal health checks
- Pingdom for external service monitoring and paging
- GeoIP for mapping IPs to locations
Pretty standard. The reason why we chose each of these things was the same — reliability. Even memcached, which is the conceptually simplest of these technologies and used by so many other companies, had some REALLY nasty memory corruption bugs we had to deal with, so I shudder to think about using stuff that’s newer and more complicated. My only suggestion for choosing technology would be to pick lightweight things that are known to work and see a lot of use outside your company, or else be prepared to become the “primary contributor” to the project.
Simulate/analyze things before trying them
Unlike product, which is harder to reason about, backend engineering is fairly objective (optimize page load time, uptime, etc.) and so we can use this to our advantage. If you think something will produce a result, you might consider simulating the effects in an easier way before committing to implementing it. Like toying around with moving your database server to a place with more latency, add in a few ms of latency in your low-level database glue and see what happens.
The security-convenience tradeoff
Security is really important for Dropbox because it’s people’s personal files. But all services are different, and many security decisions will inconvenience someone, whether it’s a programmer or a user. Having internal firewalls between servers that don’t need to talk to each other — again a good idea. But if your service doesn’t actually need this, don’t necessarily do it, or do it where it matters. Maybe this is controversial… but security is something that people like to do lip-service to and armchair philosophize about, but in reality I think a lot of services (even banks!) have serious security problems. So figure it out if it really is important to you (are you worth hacking? do you actually care if you’re hacked? is it worth the engineering or product cost?) before you go and lock down everything.
Frequently Asked Questions about Scaling Lessons Learned at Dropbox
What are the key scaling lessons learned from Dropbox’s growth from 4K to 40 million users?
Dropbox’s journey from 4K to 40 million users offers several key lessons in scaling. Firstly, it’s crucial to build a robust and scalable architecture from the start. Dropbox’s initial architecture was designed to handle a large number of users, which helped it manage the rapid growth. Secondly, Dropbox learned the importance of continuous testing and monitoring to identify and fix issues before they become major problems. Lastly, Dropbox realized the value of a strong team that can adapt and respond to challenges quickly and effectively.
How did Dropbox manage its rapid user growth?
Dropbox managed its rapid user growth through a combination of scalable architecture, continuous testing, and a strong team. The company’s architecture was designed to handle a large number of users, which helped it manage the rapid growth. Continuous testing and monitoring allowed Dropbox to identify and fix issues before they became major problems. Additionally, Dropbox’s team was able to adapt and respond to challenges quickly and effectively, which was crucial in managing the rapid user growth.
What challenges did Dropbox face during its growth and how did it overcome them?
Dropbox faced several challenges during its growth, including managing a rapidly increasing user base, maintaining performance and reliability, and dealing with security issues. The company overcame these challenges through a combination of scalable architecture, continuous testing, and a strong team. Dropbox’s architecture was designed to handle a large number of users, which helped it manage the rapid growth. Continuous testing and monitoring allowed Dropbox to identify and fix issues before they became major problems. Additionally, Dropbox’s team was able to adapt and respond to challenges quickly and effectively.
How important was Dropbox’s architecture in managing its growth?
Dropbox’s architecture was crucial in managing its growth. The company’s initial architecture was designed to handle a large number of users, which helped it manage the rapid growth. As the user base grew, Dropbox continued to evolve its architecture to ensure it could handle the increasing load. This scalable architecture was a key factor in Dropbox’s ability to manage its rapid user growth.
How did Dropbox ensure the performance and reliability of its service during its growth?
Dropbox ensured the performance and reliability of its service during its growth through continuous testing and monitoring. This allowed the company to identify and fix issues before they became major problems. Additionally, Dropbox’s scalable architecture was designed to handle a large number of users, which helped ensure the performance and reliability of the service.
What role did Dropbox’s team play in managing its growth?
Dropbox’s team played a crucial role in managing its growth. The team was able to adapt and respond to challenges quickly and effectively, which was crucial in managing the rapid user growth. Additionally, the team’s expertise and dedication were key factors in Dropbox’s ability to overcome the challenges it faced during its growth.
How did Dropbox deal with security issues during its growth?
Dropbox dealt with security issues during its growth through a combination of robust security measures and continuous monitoring. The company implemented strong security measures to protect user data and continuously monitored its systems to identify and address any potential security issues. This proactive approach to security was crucial in ensuring the safety of user data during Dropbox’s rapid growth.
What can other companies learn from Dropbox’s scaling lessons?
Other companies can learn several key lessons from Dropbox’s scaling experience. Firstly, it’s crucial to build a robust and scalable architecture from the start. Secondly, continuous testing and monitoring are essential to identify and fix issues before they become major problems. Lastly, having a strong team that can adapt and respond to challenges quickly and effectively is crucial in managing rapid growth.
How did Dropbox maintain user satisfaction during its rapid growth?
Dropbox maintained user satisfaction during its rapid growth by ensuring the performance and reliability of its service. The company’s scalable architecture, continuous testing, and monitoring, and strong team all contributed to maintaining a high level of service, which in turn helped maintain user satisfaction.
How did Dropbox’s growth strategy evolve as it scaled from 4K to 40 million users?
Dropbox’s growth strategy evolved as it scaled from 4K to 40 million users. Initially, the company focused on building a robust and scalable architecture. As the user base grew, Dropbox shifted its focus to continuous testing and monitoring to ensure the performance and reliability of its service. Additionally, the company placed a strong emphasis on building a strong team that could adapt and respond to challenges quickly and effectively.

