
Key Takeaways
- Data visualization is crucial in modern data handling, and there are numerous libraries available to help with this task. These libraries can be classified into two types: server-side and client-side components, each with its own pros and cons.
- Google Charts, which is a client-side component, allows users to create charts entirely in PHP. It’s free to use and offers lots of code examples to get started quickly. However, it doesn’t allow hosting of Google’s JS files on your server.
- FusionCharts, another client-side component, offers a PHP wrapper to leverage its library of more than 90+ interactive charts and 965 maps. It’s a paid option, but the wrapper is free, and a license is needed for commercial applications.
- For server-side components, pChart and ChartLogix PHP Graphs are good options. pChart is under active development and generates images for charts, but lacks the interactivity of client-side libraries. ChartLogix PHP Graphs is suitable for basic charts and is priced at $44.99 for unlimited commercial use.
Data is everywhere around us, but it is boring to deal with raw data alone. That’s where visualization comes into the picture.

If you take a look at the Google Trends plot below, you will realize that interest in Data Visualization has seen a steady growth over the years.
So, if you are dealing with data and are not already using some kind of charting component, there is a good chance that you are going to need one soon. That’s the reason I decided to make a list of libraries that will make the task of visualizing data easier for you.
But before we get started, you need to understand that there are two types of charting components: server side and client side. Both have their pros and cons, and what’s best for you completely depends on the objective of your project and the resources you have. I’ve covered client side charts in this post, but there is some overlap as you’ll see below.
Server Side vs Client Side Chart Generation
Server side components usually generate image charts. They employ algorithms to convert data into chart images and increase server overhead. Apart from using the server’s processing power, image based charts increase the bandwidth consumption. Sometimes large image sizes lead to slow downloads, which might be annoying to end users.
The above limitations of server side charts can be overcome by using client side components (JavaScript based). A browser will fetch the JSON or XML data from the server and render the charts locally. Client side components also have a greater scope of customization. They are often interactive, support animation and can easily blend into the design of your application.
Some charting libraries (like FusionCharts) provide wrappers which allow you to write your code in PHP only. Using the PHP wrapper you can generate the required JavaScript and HTML code as a string on the server. You can then output these strings in the page to generate charts.
With this in mind, let’s go through some options for charting that have PHP components.
Google Charts (Client Side)
Although it is JavaScript based, Google Charts has a couple of options to make your charts entirely in PHP. You can either use server-side code (in our case PHP) to get the data, or get one of the open-source wrappers to do it for you.
The good thing about Google Charts, apart from it being completely free, is the fact that they have lots of code examples to help you get started quickly.
One important point to keep in mind about Google Charts is that you are not allowed to host Google’s JS files on your server.
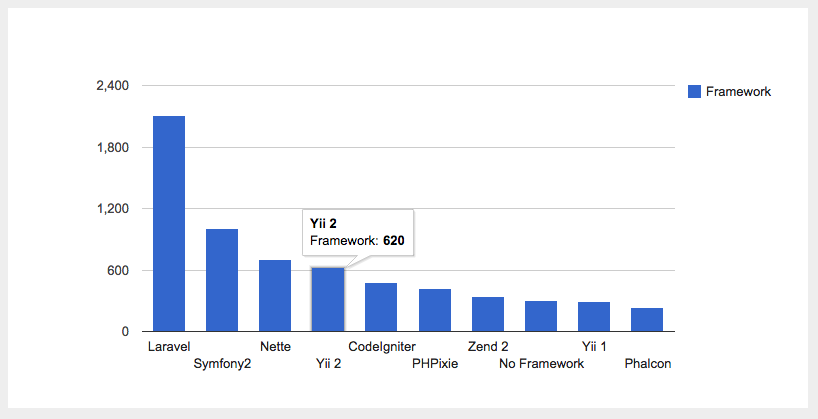
Creating Charts Using Google Charts:
I have plotted data from the SitePoint survey of most popular PHP frameworks in 2015. To see the live chart, go here and click ‘Run’.
Here’s the HTML code for the chart: (you can view the full code here.)
<html>

  <head>

    <!--Load the AJAX API-->

    <script type="text/javascript" src="https://www.google.com/jsapi"></script>

    <script type="text/javascript" src="//ajax.googleapis.com/ajax/libs/jquery/1.10.2/jquery.min.js"></script>

    <script type="text/javascript">
    // Load the Visualization API.

    google.load('visualization', '1', {'packages':['corechart']});
    // Set a callback to run when the Google Visualization API is loaded.

    google.setOnLoadCallback(drawChart);
    function drawChart() {

      var jsonData = $.ajax({

          url: "getData.php",

          dataType:"json",

          async: false

          }).responseText;
      // Create our data table out of JSON data loaded from server.

      var data = new google.visualization.DataTable(jsonData);
      // Instantiate and draw our chart, passing in some options.

      var chart = new google.visualization.ColumnChart(document.getElementById('chart_div'));

      chart.draw(data, {width: 800, height: 400});

    }
    </script>

  </head>
  <body>

    <!--Div that will hold the column chart-->

    <div id="chart_div"></div>

  </body>

</html>
Here’s the getData.php file included in code above:
<?php
// It reads a json formatted text file and outputs it.
$string = file_get_contents("data.json");

echo $string;
// Instead you can query your database and parse into JSON.
?>
FusionCharts (Client Side)
FusionCharts is primarily famous for its JavaScript or jQuery charts, but not many developers are aware of its official PHP wrapper. You can leverage FusionCharts’ exhaustive library of more than 90+ interactive charts and 965 maps through its PHP wrapper. Their charts are highly customizable and they have a pretty active support system in place.
They have a nice collection of dashboards (many of which are available for free download) and a huge chart fiddles gallery for inspiration.
An important point to keep in mind about FusionCharts is that it’s a paid option. Although the wrapper is free, you will need a license to use the library in commercial applications. That should not be as big a deal as it sounds as you can always download the free trial which has no feature restrictions.
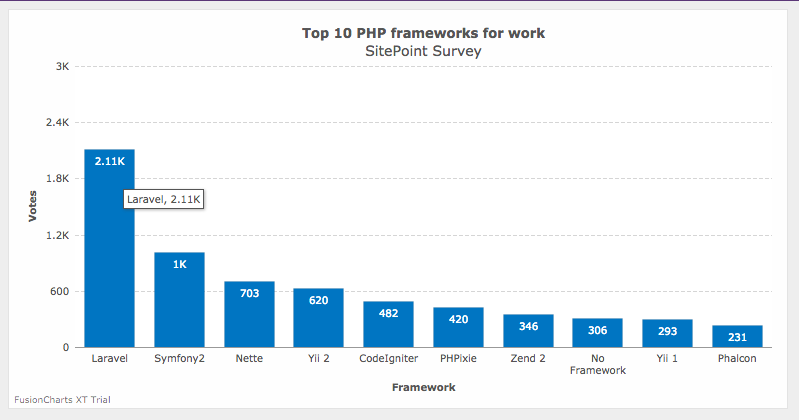
Creating Charts Using FusionCharts:
To see the chart live, go here and click ‘Run’.
Here is the PHP code to generate a column chart: (you can view the full code here)
<html>

    <head>

        // Including FusionCharts library files

        <script src="fusioncharts.js"></script>

    </head>

        <body>

        <?php

        // Example of how to draw a chart using FusionCharts and PHP.

        // fusioncharts.php functions to help us easily embed the charts.

    include("fusioncharts.php");

        ?>
        <?php

         // Create the chart - Column 2D Chart with data given in constructor parameter

         // Syntax for the constructor - new FusionCharts("type of chart", "unique chart id", "width of chart", "height of chart", "div id to render the chart", "type of data", "actual data")
         $columnChart = new FusionCharts("Column2D", "myFirstChart" , 780, 400, "chart-1", "jsonurl", "data.json");
         // Render the chart

         $columnChart->render();

        ?>
        <div id="chart-1"><!-- FusionCharts will render here--></div>

    </body>

</html>
pChart (Server Side)
pChart is one of the few native PHP charting libraries that is still under active development. But, as discussed above, there are both pros and cons to being a purely server side charting component.
The main advantage is that you don’t have to worry about cross-device and cross-browser compatibility as pChart will generate images for you. But you lose the interactivity that client side libraries like FusionCharts and Google Charts offer.
Creating Charts Using pChart:
If you are trying to get started with pChart, SitePoint has an excellent, if somewhat old tutorial for you: Charting with pChart.
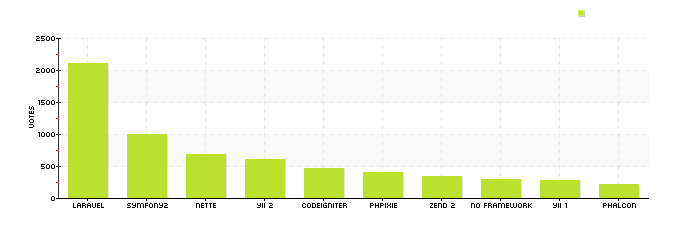
Here is the PHP code for the plot (download source code from here):
<?php

 /* CAT:Bar Chart */
 /* pChart library inclusions */

 include("../class/pData.class.php");

 include("../class/pDraw.class.php");

 include("../class/pImage.class.php");
 /* Create and populate the pData object */

 $MyData = new pData();
 /* This is the data to be plotted */

 $MyData->addPoints(array(2112,1005,703,620,482,420,346,306,293,231),"");

 $MyData->setAxisName(0,"Votes");
 /* These are the data labels */

 $MyData->addPoints(array("Laravel","Symfony2","Nette","Yii 2","CodeIgniter","PHPixie","Zend 2","No Framework","Yii 1", "Phalcon"),"Frameworks");

 $MyData->setSeriesDescription("Frameworks","Framework");

 $MyData->setAbscissa("Frameworks");
 /* Create the pChart object */

 $myPicture = new pImage(700,230,$MyData);
 /* Turn off Antialiasing */

 $myPicture->Antialias = FALSE;
 /* Add a border to the picture */

 $myPicture->drawRectangle(0,0,699,229,array("R"=>0,"G"=>0,"B"=>0));
 /* Set the default font */

 $myPicture->setFontProperties(array("FontName"=>"../fonts/pf_arma_five.ttf","FontSize"=>6));
 /* Define the chart area */

 $myPicture->setGraphArea(60,40,650,200);
 /* Draw the scale */

 $scaleSettings = array("GridR"=>200,"GridG"=>200,"GridB"=>200,"DrawSubTicks"=>TRUE,"CycleBackground"=>TRUE);

 $myPicture->drawScale($scaleSettings);
 /* Write the chart legend */

 $myPicture->drawLegend(580,12,array("Style"=>LEGEND_NOBORDER,"Mode"=>LEGEND_HORIZONTAL));
 /* Turn on shadow computing */

 $myPicture->setShadow(TRUE,array("X"=>1,"Y"=>1,"R"=>0,"G"=>0,"B"=>0,"Alpha"=>10));
 /* Draw the chart */

 $myPicture->setShadow(TRUE,array("X"=>1,"Y"=>1,"R"=>0,"G"=>0,"B"=>0,"Alpha"=>10));

 $settings = array("Gradient"=>TRUE,"GradientMode"=>GRADIENT_EFFECT_CAN,"DisplayPos"=>LABEL_POS_INSIDE,"DisplayValues"=>TRUE,"DisplayR"=>255,"DisplayG"=>255,"DisplayB"=>255,"DisplayShadow"=>TRUE,"Surrounding"=>10);

 $myPicture->drawBarChart();
 /* Render the picture (choose the best way) */

 $myPicture->autoOutput("pictures/example.drawBarChart.simple.png");

?>
ChartLogix PHP Graphs (Server Side)
If you require only basic charts in your application, then ChartLogix PHP Graphs can be a good option. It has a limited collection that contains most commonly used charts like bar, pie, line etc., and is priced at just $44.99 for unlimited commercial use.
Although not in active development, it still provides personal support to all the buyers. It renders the output as an image and offers customisation of layouts, fonts, colour schemes & some visual effects.
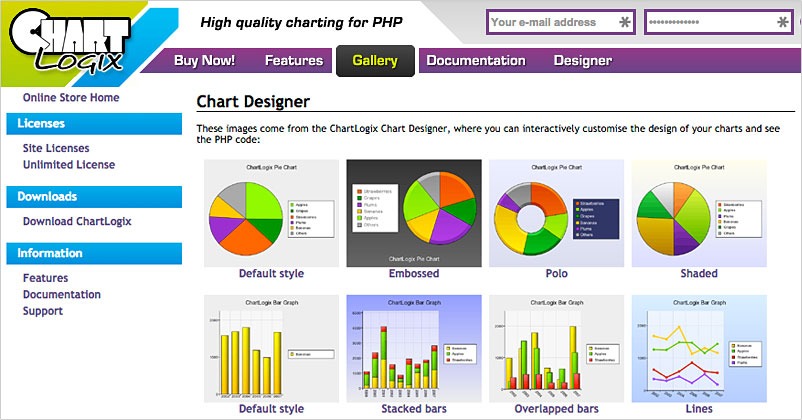
Creating Charts Using ChartLogix PHP Graphs:
ChartLogix does not come with a free trial, but that’s not a big problem because you can always use their designer feature to get familiar with the code and design. In fact, this is going to save you a lot of time as you can evaluate it within minutes.
Below is the code to generate a bar chart and you can visit this page to play with it.
<?php

  include( 'chartlogix.inc.php' );
  $bar = new BarChart();
  //---- THE STYLE
  $bar->setBackground( 'EEEEEE', 'EEEEEE' );

  $bar->setPadding( 20 );
  $bar->setDefaultFont( 'arial.ttf' );

  $bar->setTitleStyle( 'arial.ttf', 15, '000000' );

  $bar->setTitlePosition( 0, 0 );
  $bar->setLegendWidth( 40.00 );

  $bar->setLegendTextStyle( 'arial.ttf', 10, '000000', 10 );

  $bar->setLegendKeyStyle( 10, 10 );

  $bar->setLegendBoxStyle( 'FFFFFF', '000000', 10 );

  $bar->setLegendPosition( 1, 0 );
  $bar->setXAxisTextStyle( 'arial.ttf', 10, '000000', 0 );

  $bar->setYAxisTextStyle( 'arial.ttf', 10, '000000' );

  $bar->setColumnSpacing( 25 );

  $bar->setStackedBarSpacing( 0 );
  //---- THE DATA
  $bar->setTitle( 'ChartLogix Bar & Line Graph' );
  $bar->addColumns( array( '2002', '2003', '2004', '2005', '2006', '2007' ) );
  $bar->doBarSeries( 'Bananas', 'FFFF00', 'FFCC00' );
  $bar->setValueStyle();
  $bar->addData( '2002', 1498 );

  $bar->addData( '2003', 358 );

  $bar->addData( '2004', 675 );

  $bar->addData( '2005', 1449 );

  $bar->addData( '2006', 1335 );

  $bar->addData( '2007', 137 );
  //---- DRAW PNG
  $bar->drawPNG( 500, 400 );

?>
Conclusion
I hope you find the above libraries useful, but if you want more options do check out PHPGraphLib and JpGraph. PHPGraph is a lightweight server side library and completely free to use for all purposes. JpGraph on the other hand offers a trimmed down free version. Both of these libraries are not under active development now, but their current stable version still works well.
Charting is a crowded space and this is in no way a complete list of tools available for PHP charting. Instead, I’ve tried my best to list the tools that have a proven track record and would make the task of creating beautiful charts easier for you.
Do you use another PHP charting tool that I didn’t include here? Would love to learn about it in the comments section below.
Frequently Asked Questions about PHP Chart Generation Options
What are the key features to look for in a PHP chart generation component?
When choosing a PHP chart generation component, there are several key features to consider. Firstly, the component should support a wide range of chart types, such as line, bar, pie, and scatter charts. Secondly, it should offer customization options to allow you to tailor the charts to your specific needs. Thirdly, the component should be easy to use and integrate into your existing PHP projects. Lastly, it should have good documentation and support to help you troubleshoot any issues that may arise.
How does the performance of different PHP chart generation components compare?
The performance of PHP chart generation components can vary significantly. Some components are highly optimized and can generate charts quickly, even with large datasets. Others may be slower, especially when handling complex charts or large amounts of data. It’s important to test the performance of a component with your specific use case before deciding to use it.
Are there any free PHP chart generation components available?
Yes, there are several free PHP chart generation components available. These include pChart, Chart.js, and Google Charts. While these components may not offer as many features as some of the paid options, they can still be a good choice for simple charting needs.
How do I integrate a PHP chart generation component into my project?
Integrating a PHP chart generation component into your project typically involves including the component’s library in your project, initializing the component, and then using its API to create and customize your charts. The exact steps can vary depending on the specific component you are using.
Can I use PHP chart generation components with other programming languages?
While PHP chart generation components are designed to be used with PHP, some of them can also be used with other programming languages. For example, Google Charts can be used with JavaScript in addition to PHP. However, you may need to do some additional work to integrate the component with a non-PHP language.
What are some common issues that can arise when using PHP chart generation components?
Some common issues that can arise when using PHP chart generation components include performance issues, compatibility issues with different versions of PHP, and difficulties with customization. Good documentation and support can help you overcome these issues.
How can I customize the appearance of my charts?
Most PHP chart generation components offer a variety of customization options. These can include changing the colors, fonts, and sizes of the chart elements, adding labels and legends, and adjusting the scale and axes of the chart. The exact customization options available will depend on the specific component you are using.
Can I use PHP chart generation components to create interactive charts?
Yes, many PHP chart generation components support the creation of interactive charts. These charts can include features like tooltips, zooming and panning, and clickable elements. However, creating interactive charts can be more complex than creating static charts, so it’s important to choose a component that offers good support for interactivity.
Can I use PHP chart generation components to create real-time charts?
Yes, some PHP chart generation components support the creation of real-time charts. These charts can automatically update to reflect new data as it becomes available. This can be particularly useful for applications that need to display constantly changing data, such as stock market applications.
How can I troubleshoot issues with my PHP chart generation component?
If you’re having issues with your PHP chart generation component, the first place to look is the component’s documentation. This should provide information on common issues and how to resolve them. If you can’t find the information you need in the documentation, you can try reaching out to the component’s support team or community for help.