
This article was sponsored by Dareboost. Thank you for supporting the partners who make SitePoint possible.
Website performance is serious business. How many times have you become outrageously frustrated with a slow-loading website? If you’re anything like me, you’ve probably closed a great number of tabs — and never returned to the offending website.
Having a slow website will turn visitors away, which means reduced pageviews, conversions, interactions, sales, and advertising revenues. Additionally, if you’re running an online business, it will also result in shopping cart abandonment.
According to WPO Stats, The Trainline team found that reducing their product’s latency by 0.3 seconds across the conversion funnel led to customers spending an extra $11.5 million per year.
Fortunately, it’s really easy to monitor and manage website performance, and that’s where Dareboost comes in.
Dareboost is a platform that will keep track of website performance and quality, and it’s really easy to use — you don’t need to install anything. Sign up for an account, plug in your website details, and let it work its magic.
Dareboost is a freemium product. While you can get rich, useable data from a free account, the more advanced tooling is available for paid accounts.
Dareboost’s tools provide you with great data, with standalone analyses providing actionable data immediately. Additionally, Dareboost’s monitoring tools accumulate data about your site’s performance over time, offering deeper insights.
Dareboost also has great alert functionality, allowing you to set up custom alerts for the metrics that are important to you.
Who Is Dareboost For?
Whether you run your own blog or you’re involved in your company’s online presence, Dareboost is for you if you have a vested interest in website performance. Every web professional can benefit from this tool.
With Dareboost’s website performance and quality management, you are able to test, analyze, benchmark, and optimize your website.
Website Performance and Quality Analysis
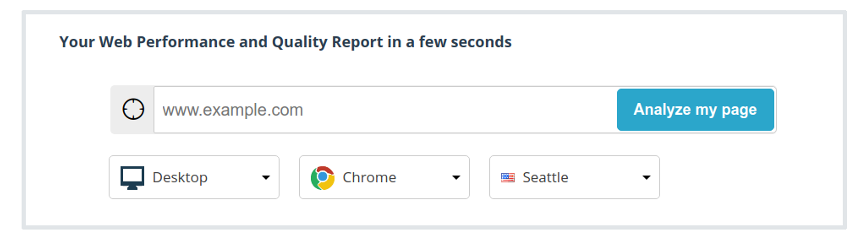
Let’s jump straight in and check out some of these great features, starting with the Website Speed Test. Please note we’re using a premium account, which provides more options that we’ll explore below.
First, you need to choose a page to test. You can also select if you want to test against a desktop using Chrome, or a mobile device, choosing one of five Android options or an iPhone 6, and a location.
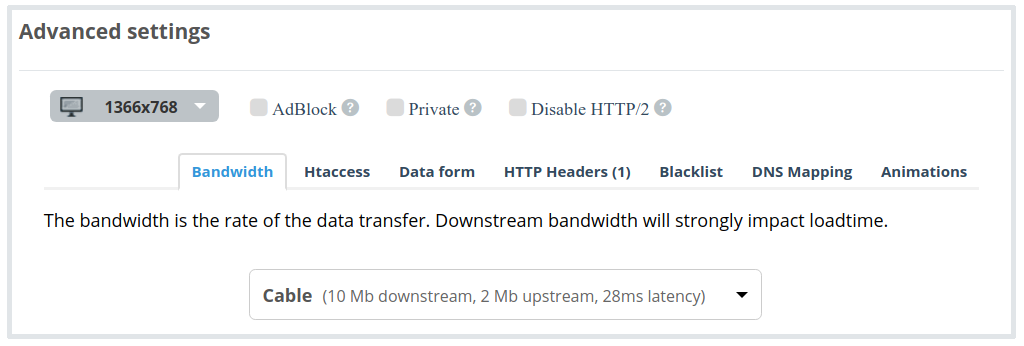
Then there are some advanced settings. You can provide htaccess authentication credentials, decide whether you want to block ads or other scripts for the test, keep the report private to just yourself, and whether you’d like to disable HTTP/2.
Further, you can:
- Set the bandwidth available to the test — 3G, cable, fiber, or custom values.
- Set various screen resolutions to test.
- Mimic a POST request, to simulate what a user would see after form submission.
- Set HTTP headers, such as user agent.
- Allow and deny queries from certain domains.
- Map a hostname to another one, or by IP, and…
- Deny all kinds of animations.
All in all, you’re getting real browser testing, which you can setup to emulate almost any kind of potential visitor.
Once you’ve made your choices, it’s just a matter of executing the test. Regardless of your account type, you’ll get the same amazingly detailed report, starting off with an overview of website quality and performance.
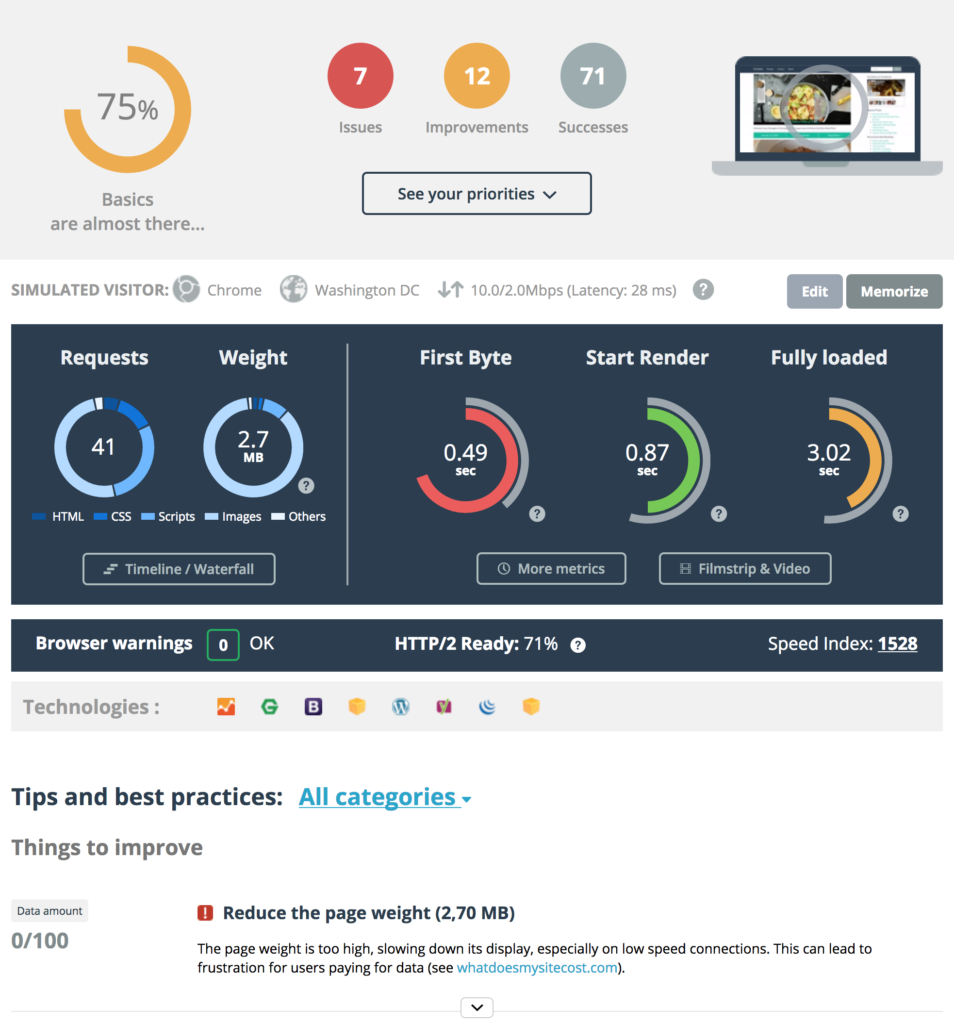
Straight away, we get an idea of how my chosen website performs, including 7 errors and 11 improvements highlighted. We’re also told how many requests are made, and the data transfer required to build the page. The report also tells us the TTFB (time to first byte, a measure of server response speed), how long the page takes to start rendering, and how long until the page is completely loaded.
It also notes the various technologies detected on the website. For this site, we can see Google Analytics, Gravatar, Bootstrap, Twemoji, WordPress, Yoast SEO, jQuery, and PHP.
But perhaps one of my favorite features is being able to watch a video of how the page appears throughout the loading and rendering process, shown below in gif format for your viewing pleasure.

You can use the filmstrip to view the process frame by frame, and there are a range of metrics computed via video analysis. These include Start Render, Speed Index and Visually Complete, and are very useful metrics for improving your user experience (UX).
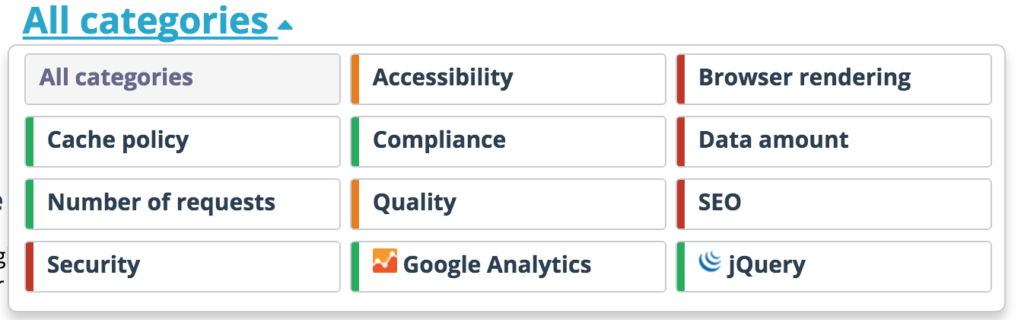
To figure out what to work on first, you can click on the “See your priorities” button (pictured above in the report screenshot), or refine the view depending on what category of issue you want to start with. You’ll probably want to start with anything with a red marker, as they are arguably where you can make the easiest gains.
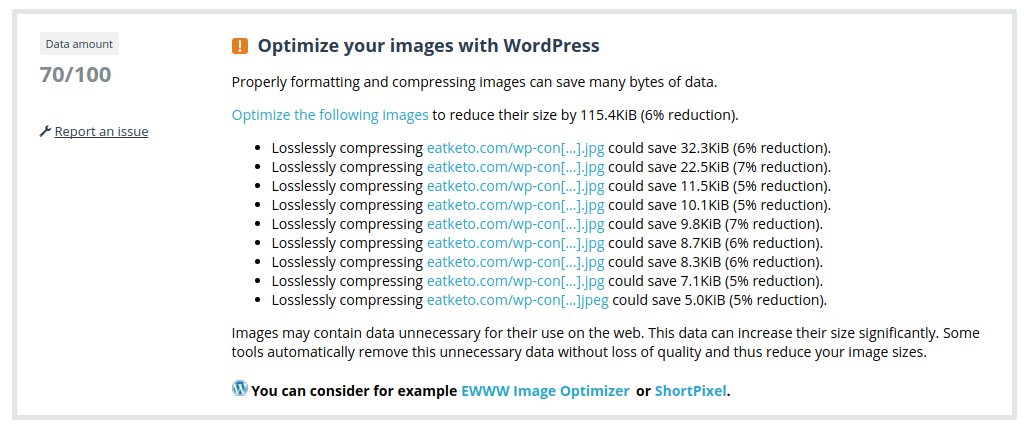
An area of improvement for the site I tested was image size, and because Dareboost knows the site runs on WordPress, it will tell me exactly which images need to be optimized and provides a few suggestions on plugins that will get the job done.
Dareboost will judge your page against over 100 criteria in at least 9 categories. That’s far too many to dive into here, and given the Website Speed Test is completely free, I recommend you jump in and try it out.
Website Performance Monitoring
Next up we have Website Performance Monitoring, which allows you to monitor pages on your site over time.
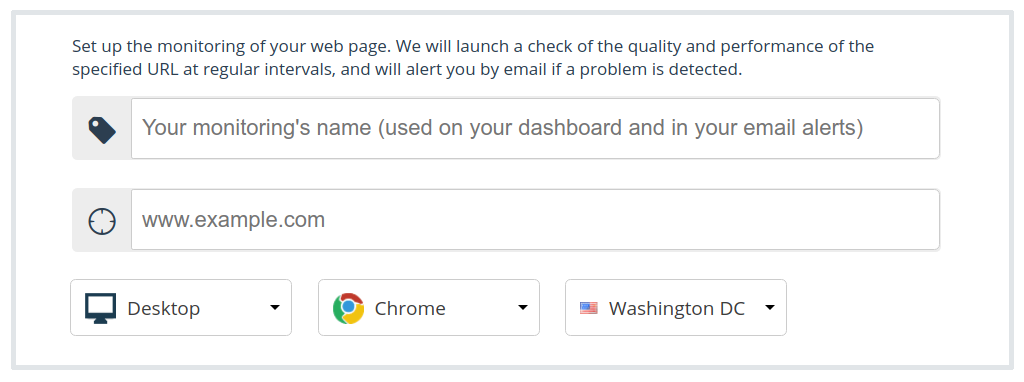
Adding a page to Monitoring is very easy. In fact, it largely uses the same interface from the Performance and Quality testing tools, with a few additions. The immediate difference here is setting a name — otherwise the settings, including Advanced, are identical.
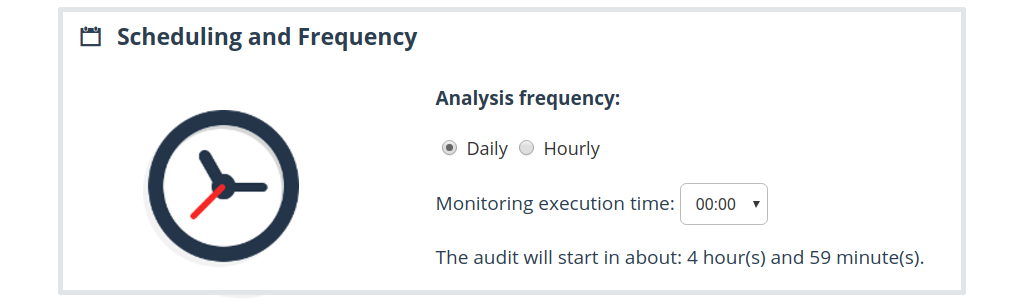
Past this you can set the schedule, where you choose from daily or hourly monitoring (a 15 minute frequency is also available on demand). If you’re choosing daily, you can set the time of day that it executes — if you choose hourly, it’ll simply run once per hour.
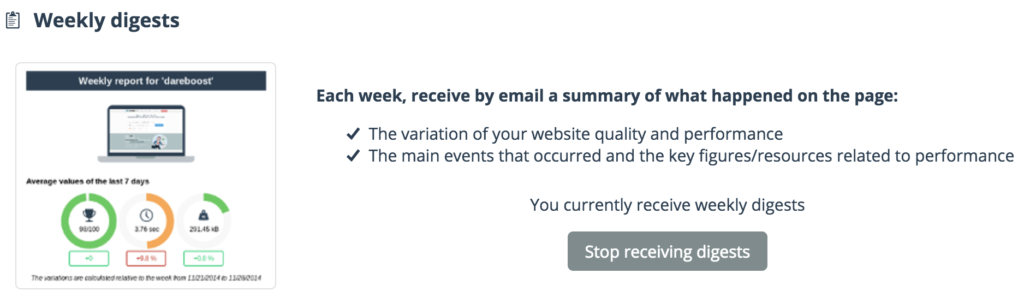
Finally, you can modify your digest settings. By default you will receive a weekly email digest, and naturally the only option here is for disabling it.
Once you have this configured, just click save and Dareboost will take care of the rest.
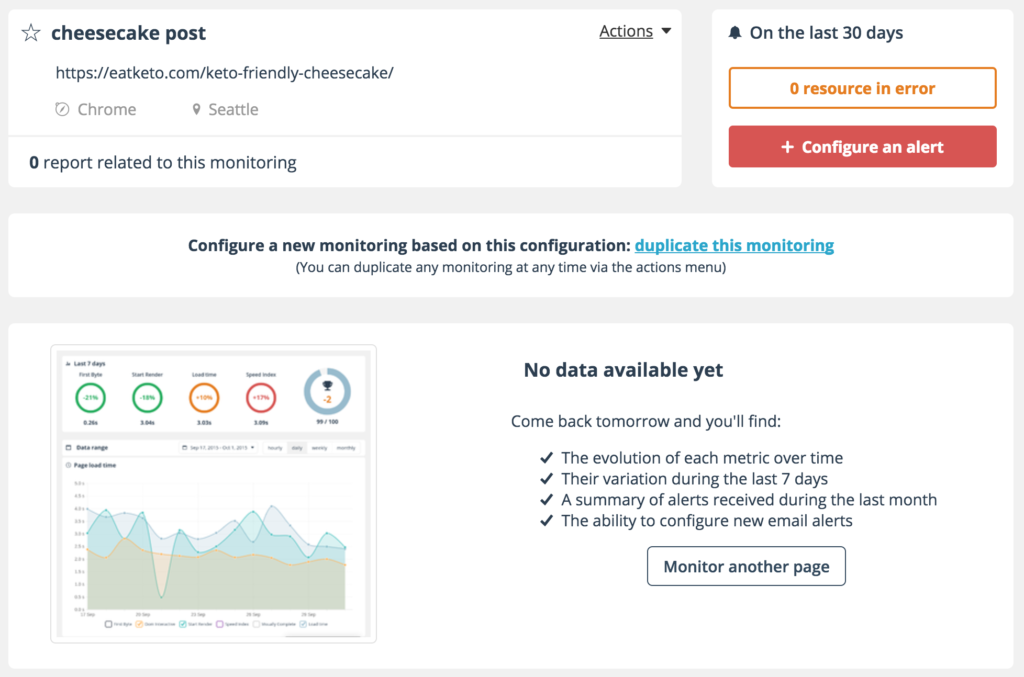
At first you’ll see an overview as shown below, which will have no data as the monitoring has not yet begun. However, you can now configure alerts.
Setting up an alert is straightforward. You just need to choose which metric you want to be alerted about, and the threshold for triggering an alert when the metric is above or below a certain number. This feature will help you immediately detect slowdowns and quality regressions, or know when a page is becoming too heavy.
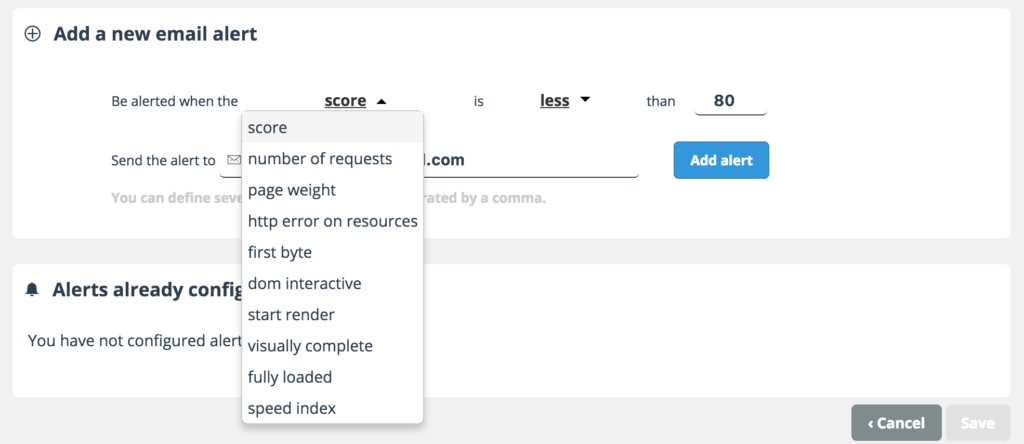
I’ve set up an alert that will notify me if my page is triggering HTTP errors (broken images, third-party provider errors, etc.), since they need to be fixed quickly if they happen.

Once you have some pages set up to be monitored, all you need to do is wait for the data to be populated over time, and keep an eye out for any email alerts that may come your way.
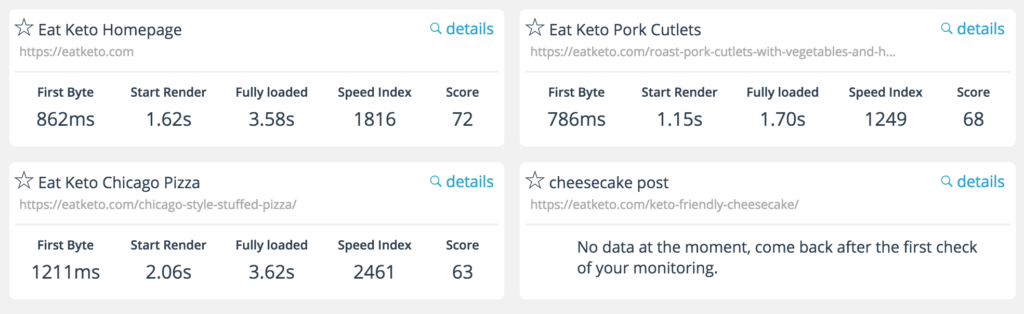
Within Dareboost you are provided with a Monitoring Dashboard, which gives you a brief look at each of the pages you have monitored, showing only the need-to-know details.
Now to show you where Monitoring really shines: viewing and analyzing the data. Click on whatever page you want to learn more about, and you’re presented with plenty of information.
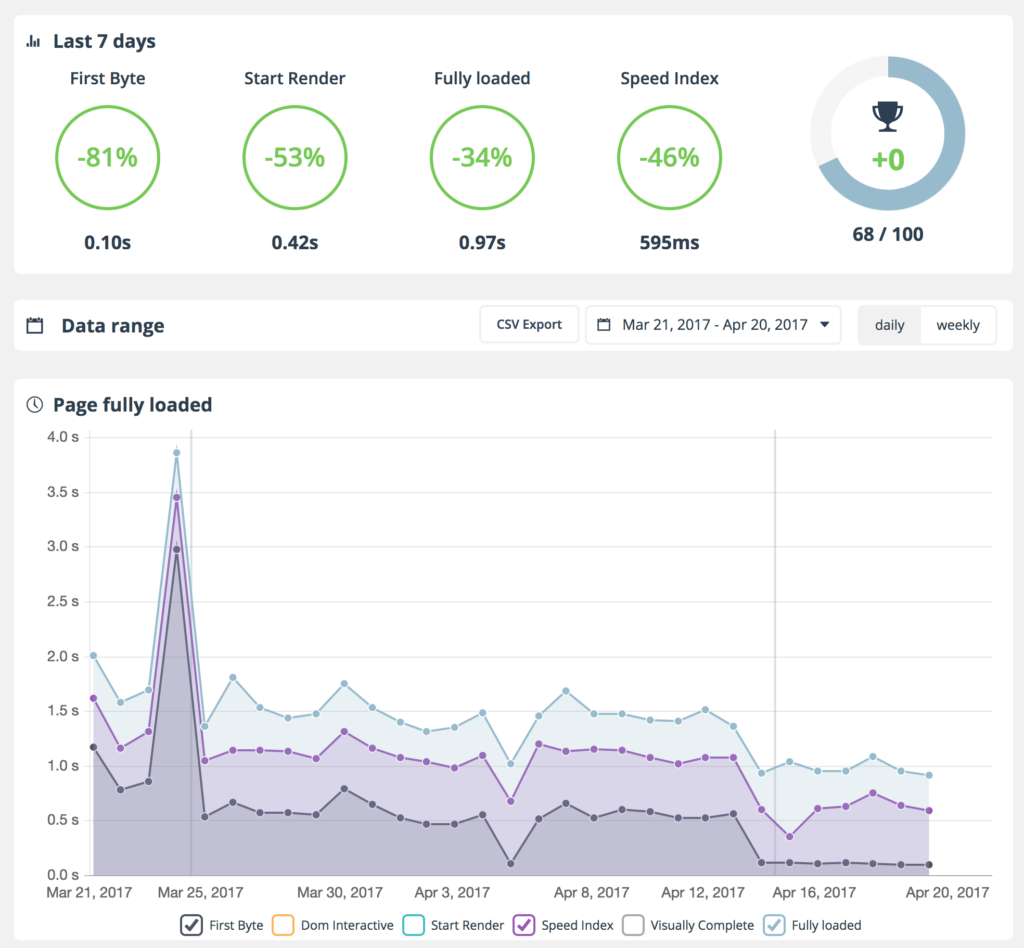
The first data you will see covers the changes in important stats from the last seven days, including TTFB, time to start rendering, time until fully loaded, speed index, and how many of Dareboost’s 100 criteria you’ve been successful in, with the graph broken down into four parts:
- Performance metrics
- Page score
- Page weight
- Number of requests
Rather than go through all of them, I’ll show you an example of the number of requests graph. I’ve focused on March 13th, where you can see 48 total requests for the page in question, predominantly images, followed by JavaScript, and then the rest.
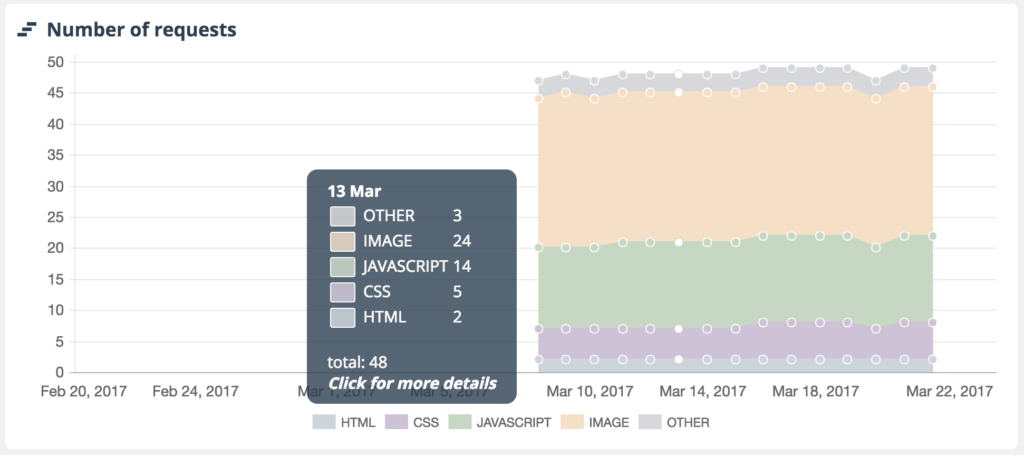
However, there was also variance over the course of the monitoring — mostly that the number of requests went up. I can’t say for sure what the cause was, but given this is a WordPress website, I’d wager it was caused by updating the WordPress core and plugins. Still, if this happened to you and isn’t so easily explained, it could be cause for concern and a good alert to you that you need to find out what’s going on.
Compare
Another great Dareboost feature is Competitive Reports. There’s a lot to it, so let’s not waste another moment and dive straight in.
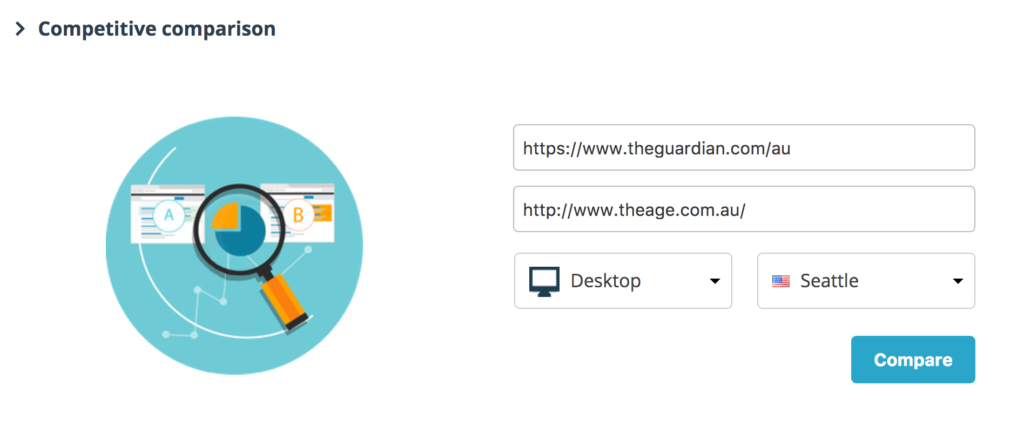
Competitive Comparison
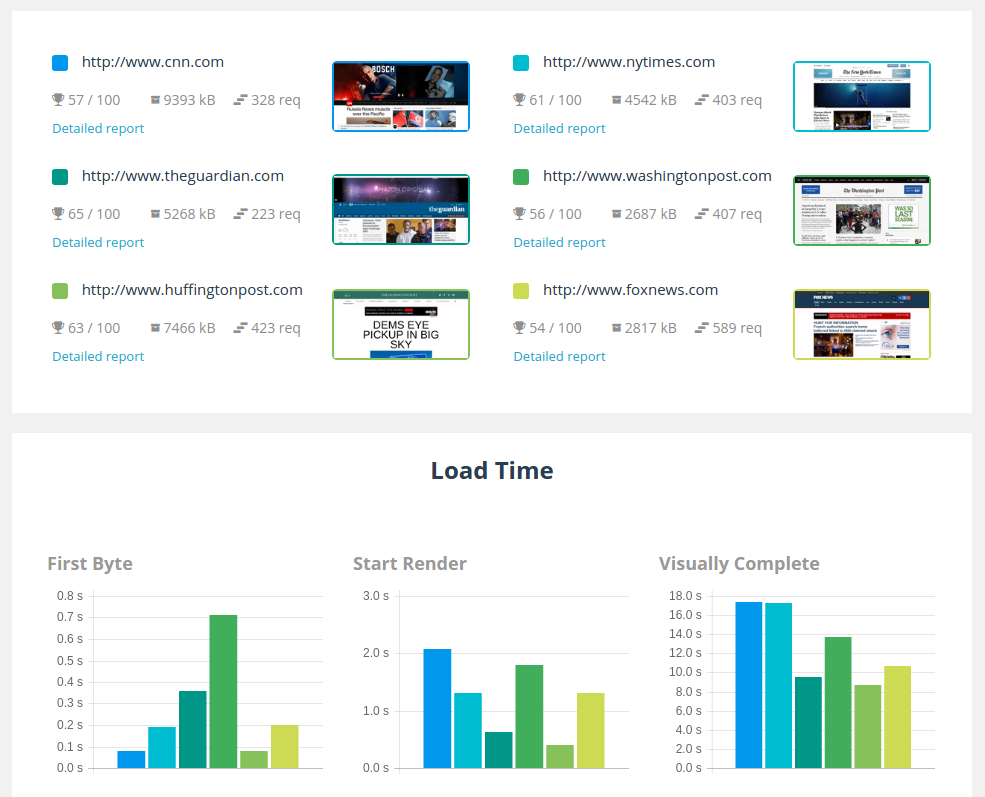
This is probably my favorite of the comparison reports. You can directly compare two web pages from any two sites, and see which has superior performance. As with the previous features, Competitive Reports is super easy to use. Enter the addresses for two pages, choose desktop or mobile, select a location, and hit go. I opted for two news websites.
If you’ve followed me this far, then you’ll have no problem reading the competitive comparison report, as it’s essentially two individual reports side-by-side. This includes a preview of each site, a list of the tech used, and an overview of quality and performance scores with links to detailed reports for each. There’s much more data shown, with the ability to drill down to get details.
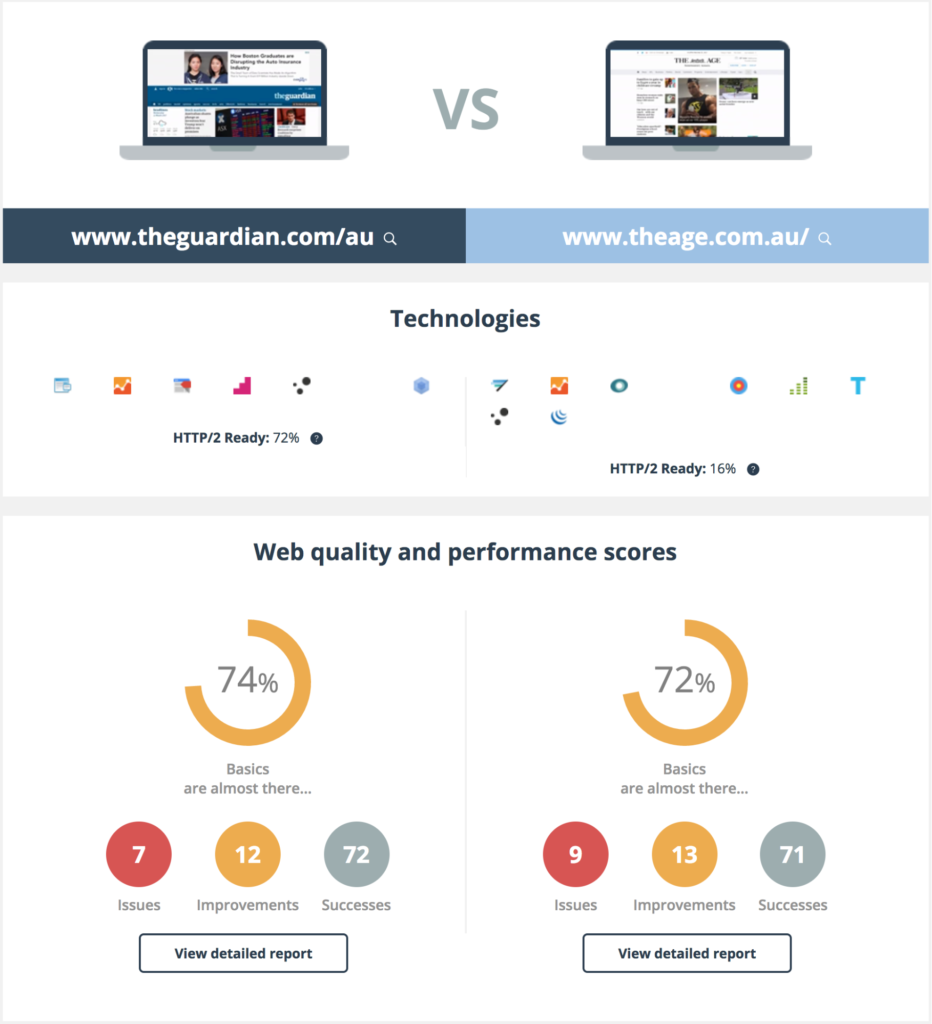
Unsurprisingly, one of my favorite features is the side-by-side video comparison. Being able to see how two pages are constructed over the same period of time is a useful way of finding out which site loads better for the user, metrics aside.
There’s a great deal of content in the report — too much to cover it in this article, so feel free to view the report online (any Dareboost report can be shared online).
Mobile vs Desktop Comparison
The Mobile vs Desktop comparison tool is especially handy if you’re looking to compare two pages on your own site, to see whether one version is lacking.
Once again, this is ultimately the same as the other reports, with the exception that there are two reports side-by-side. You can take a look at the report for yourself here.
HTTP/1.1 vs HTTP/2
I think this is a comparison report well worth paying attention to, as even though HTTP/1 will be supported for a long time to come, we’ll all be moving to HTTP/2 in due course.
What I found most interesting was that the tested page loaded in roughly the same amount time across both protocols, but was much faster to get some functional content on the screen with HTTP/2. You can view my example report here.
Cache Test
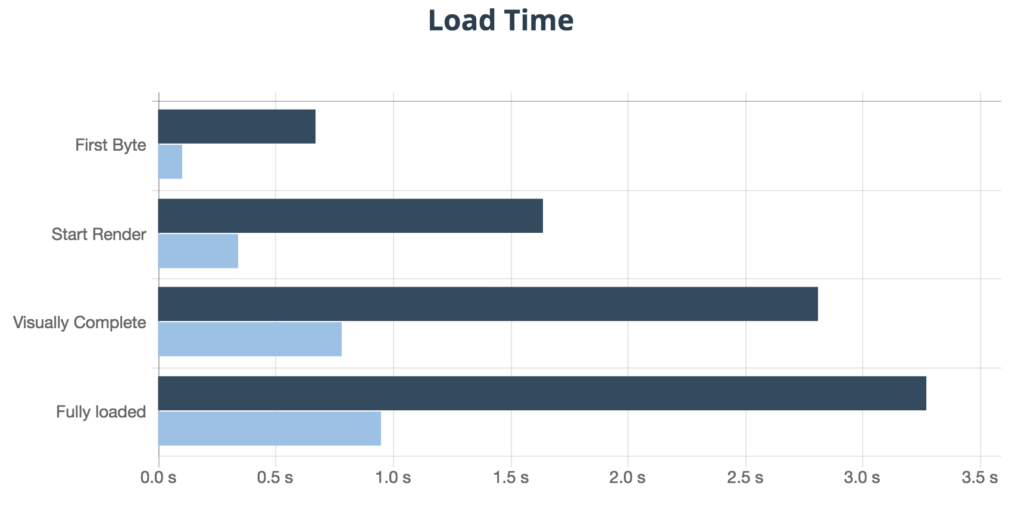
The Cache Test is a powerful tool that shows you how fast your website can be with properly cached resources, something I imagine you’re already on top of if you’re taking site performance seriously.
I’ll let the results do the talking. Here’s the load time graph, where the cached version (light blue) shows serious performance gains.
If you’re curious to see the entire report you can do so here.
Advanced Comparison
This brings us to the last of the comparison reports, the Advanced Comparison Report. In essence, it is two advanced reports side-by-side, with the ability to configure the device, location, connection, and many more advanced settings.
We’ve already looked at the content that makes up the report, but it provides a particularly comprehensive overview. Here’s our example.
Dashboard
The Dashboard is your control center for managing your Dareboost monitoring configurations and reports. At the top you can switch tabs between your standalone and comparison reports. They’re all dated and you can see high-level data before opening one.
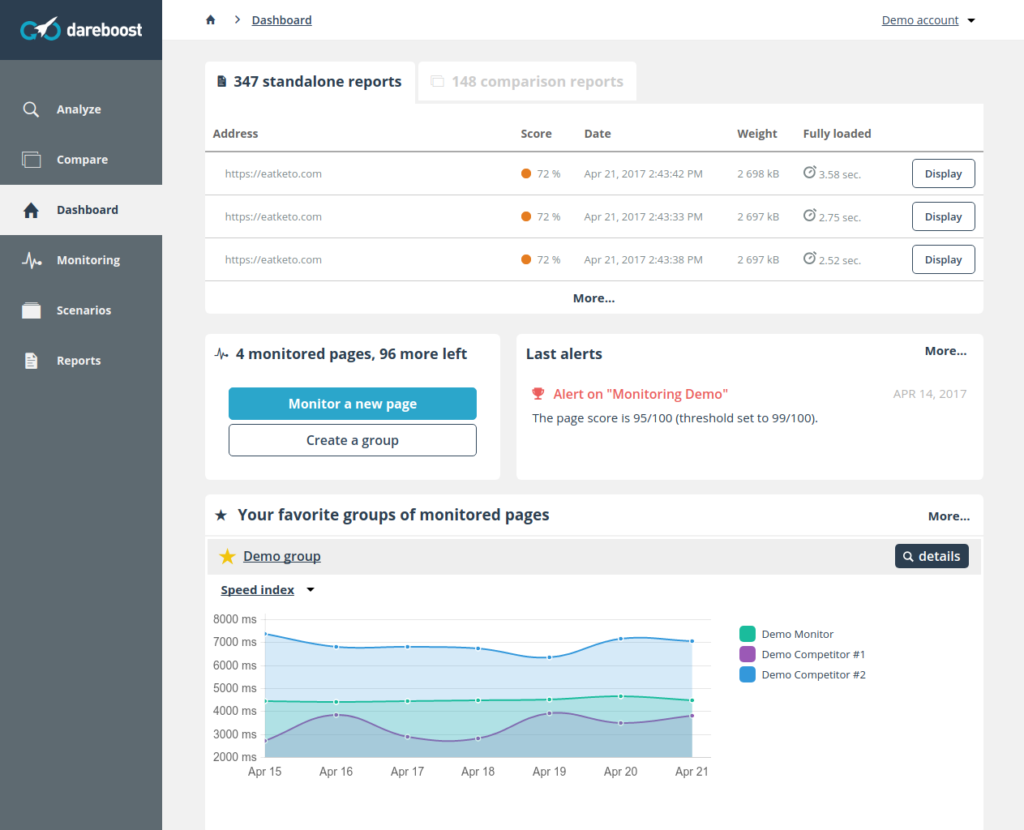
The dashboard provides shortcuts for adding a page to monitoring, creating a group, and an overview of alerts. We’re going to create a new group.
You’ll be presented with something like this:
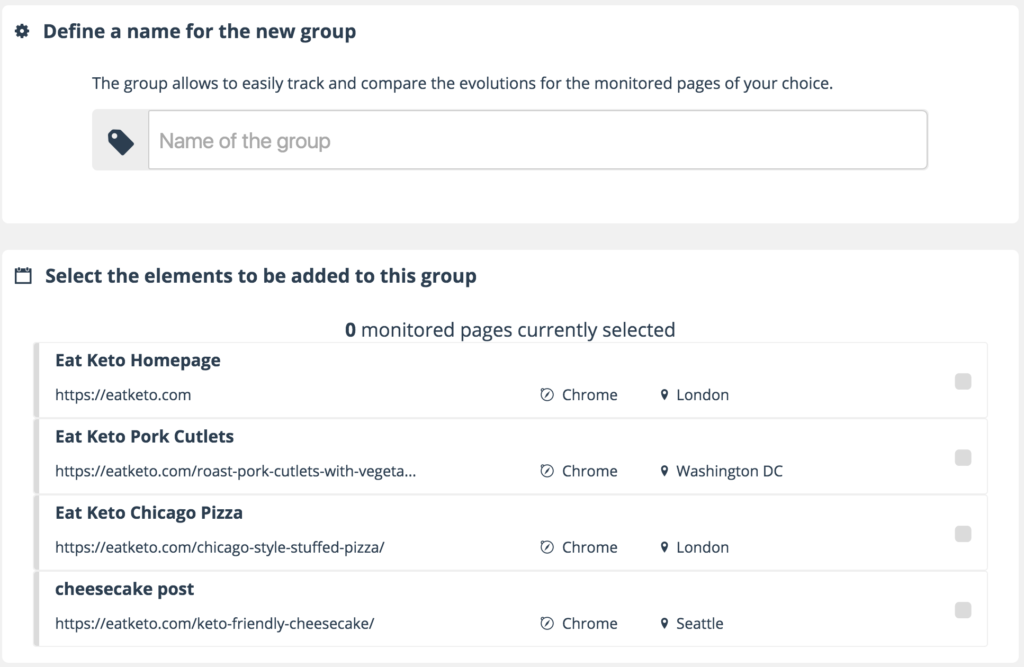
Give your tracking group a name and add any of the monitored pages you have already set up. Note that you can create as many groups as you like, and they’ll allow you to explore your monitoring data from different angles (for example, competitive benchmarking, or grouping by browsing location or project/website). Once you have created the group, you’ll see a report similar to this:
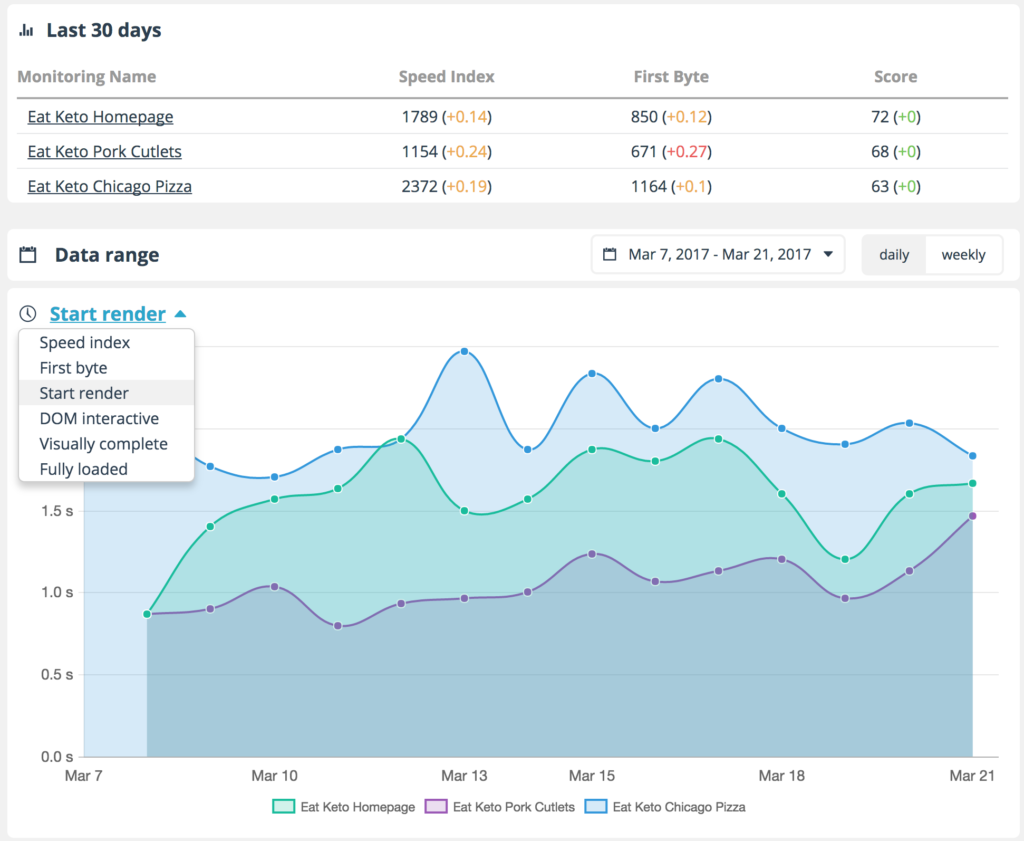
You can see some overview information for your pages and the ability to access more detailed information on any of them. The coolest thing here is the graph that shows performance of a selected metric over time across all pages in the group.
You can click on any dot in this graph and view a comparison report between all of the monitored pages (up to 12). This is what it looks like:
Conclusion
Dareboost is a powerful tool that provides a wealth of data and action items to improve performance and quality on your website — even as a free user. For both newcomers and experts in site optimization, it will give you everything you need to make your website blazing fast and recoup those lost conversions.
 Aaron Osteraas
Aaron Osteraas is a Full Stack Engineer at Vintrace. He lives and works in Melbourne, Australia. In the early 2010s, he was the Managing Editor here at SitePoint.