Unit testing and Test Driven Development (TDD) are common paradigms nowadays. If you are a JavaScript developer, Google has created and open sourced a great tool called js-test-driver to help with unit testing. js-test-driver is a JavaScript unit test runner in the spirit of JUnit, and brings TDD to JavaScript.
Unit Testing Overview
If you have never done any unit testing before, nor entered the world of TDD, you might be asking yourself what the benefits are. There are many detailed discussions on the subject, but I’ll touch on a few of the more important points.
- Unit tests are useful in regression testing. You can run unit tests after making code changes, and ensure that everything works like it used to. This is especially important in dynamic languages like JavaScript that do not give you compilation errors.
- The more complex/larger the project, the more unit tests will provide you with a return on investment
- A comprehensive suite of unit tests is almost as good as documentation. With a good suite of unit tests, a developer can open a project and start running/debugging unit tests to better understand the system. This is very helpful when on-boarding a new team member.
- JUnit is a popular Java test framework that was crucial in the development of Test Driven Development. Many of the existing testing frameworks follow the naming conventions and idioms of JUnit.
Configuring Your System
This tutorial will teach you how to set breakpoints and debug your unit tests from within an Integrated Development Environment (IDE). We will focus on the IntelliJ IDE. This tutorial uses a Microsoft Windows environment, but should work on most operating systems by adjusting the environment variables. You will also need to follow these instructions:
- Download and install IntelliJ. You can download IntelliJ from the JetBrains website.
- If you haven’t done so, download and install the Java Development Kit (JDK).
- Within IntelliJ, make sure you have installed the js-test-driver plugin. If you do not know how to do this, please refer to the JetBrains instructions for installing plugins.
- Download the latest js-test-driver.jar. At the time of writing, the latest version is 1.3.5. For the purposes of this tutorial, save the jar to
C:devtoolswebjsjs-test-driver1.3.5js-test-driver-1.3.5.jar. - Add the following environment variables so that the Java runtime can be invoked from the command line.
JAVA_HOME=C:Program FilesJavajdk1.7.0_7 (or the location of your java install)
PATH=%JAVA_HOME%bin;%PATH%
You can verify the installation by opening a command prompt and typing
java. If Java is installed correctly, you should see output similar to that shown in the screenshot below.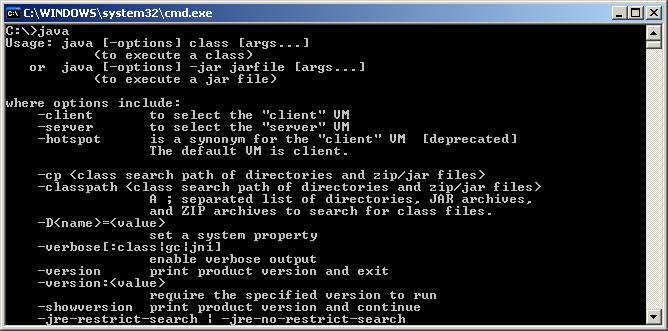
- Create a new project in IntelliJ by going to the top menu and clicking
File | New Project. I have created an IntelliJ project with a Web Module atC:projectsjs-test-driver. The IntelliJ settings are shown in the figure below.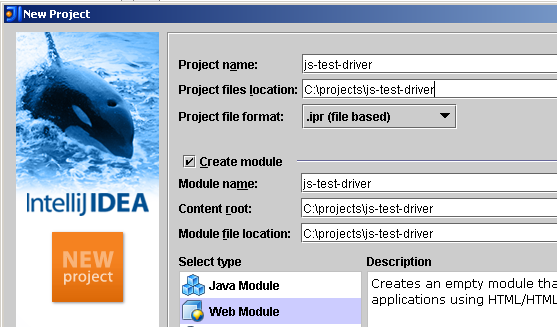
- In TDD and unit testing, it is always a good idea to have a clean, concise separation between your production code and your test code. Create the directories
srcandtestin the IntelliJ project root. After creating these directories, your project should look like the following screenshot.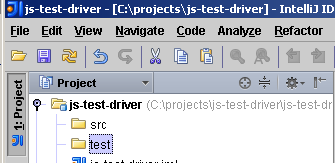
Getting Started
- We are going to add the “greeter” examples that are part of the js-test-driver project. Create a new JavaScript file named
greeter.jsunder thesrcdirectory and add the following code.myapp = {}; myapp.Greeter = function() {}; myapp.Greeter.prototype.greet = function(name) { return "Hello " + name + "!"; }; - Now we will create the unit test. Create the corresponding JavaScript test file
greetertest.jsunder thetestdirectory, and add the following code.TestCase("GreeterTest", { setUp:function () { }, "test greet": function() { var greeter = new myapp.Greeter(); assertEquals("Hello World!", greeter.greet("World")); }, "test greet null": function() { var greeter = new myapp.Greeter(); assertNull(greeter.greet(null)); } }); - In
greetertest.js, IntelliJ will not understand theTestCaseclass, and will highlight it in red. ClickTestCaseand you will be prompted for the JetBrains suggested intention. Next, clickAdd JsTestDriver assertion framework support, as shown in the following figure. Doing this will add IntelliJ IDE support for js-test-driver.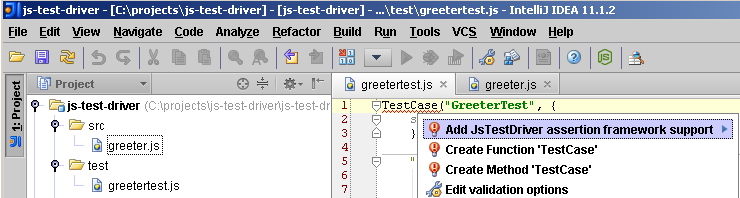
- Create a file named
js-test-driver.confin the root of your project. For the purposes of this tutorial, the full path would beC:projectsjs-test-driverjs-test-driver.conf. Add the information shown in the following image tojs-test-driver.conf.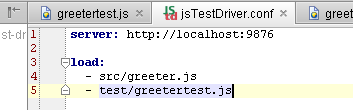
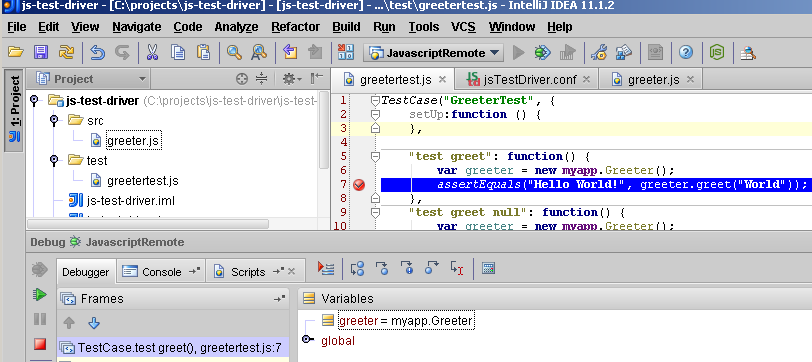
- Now let’s setup our project for debugging with a breakpoint. Set a breakpoint in the file
greetertest.jswithin thetestgreet()function. You can set a breakpoint in IntelliJ by clicking in the left hand margin. - Create a new IntelliJ Run/Debug configuration of type
JavaScript Debug | JavaScriptas shown below.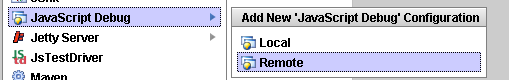
- Change the following values:
- URL to open:
http://localhost:9876/capture - Expand the directory
testand enterhttp://localhost:9876/test/testfor Remote URL
- URL to open:
- As we have seen so far, IntelliJ provides excellent js-test-driver integration. To start the js-test-driver server from directly within IntelliJ, expand the
JsTestDriver Servermenu item and click the green play button, as shown below.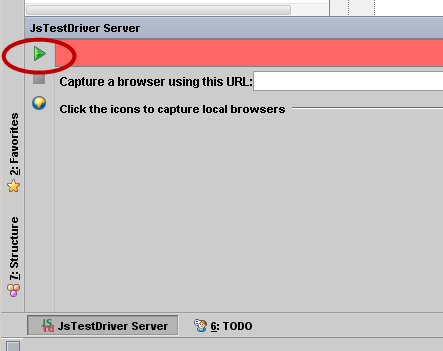
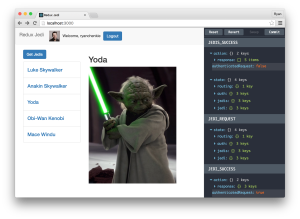
- Now let’s debug our JavaScript from within IntelliJ! Start the Debug Configuration we created earlier called
JavascriptRemote. You can do so by selectingRun | Debugfrom the menu. A new browser window will open with the js-test-driver remote console runner loaded as shown below.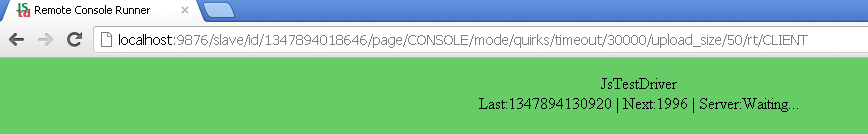
- Next, open a new command prompt.
cdto the root of the IntelliJ project. For the purposes of this project that directory isC:projectsjs-test-driver. Enter the following command:java -jar C:devtoolswebjsjs-test-driver1.3.5js-test-driver-1.3.5.jar --tests all
- After a few moments, IntelliJ should be suspended at the breakpoint we set earlier. Local variables, watch expressions, and other debug goodness will now be available to us. Note: in IntelliJ, intelligent code completion is available in watch expressions!
Conclusion
This article has taught you to debug JavaScript unit tests with js-test-driver. You should now be able to set breakpoints from within the IntelliJ development environment. Ultimately I hope this will help you produce well tested software for your current and future projects.
- Download the source code for the examples in this article!
 Stephen Lum
Stephen Lum is currently the Lead Android Developer for Visual Candy Apps. In a former life, he used to Head the trading tools desk for a major investment bank. He is a certified Java programmer, Oracle certified as a developer, and is also a CPA.