

This article is part of a series created in partnership with SiteGround. Thank you for supporting the partners who make SitePoint possible.
CSS animations are known to be super performant. Although this is the case for simple animations on a few elements, if you didn’t code your animations with performance in mind and add more complexity, website users will soon take notice and possibly get annoyed.
In this article, I introduce some useful browser DevTools features that will enable you to check what happens under the hood when animating with CSS. This way, when an animation looks a bit choppy, you’ll have a better idea why and what you can do to fix it.
Key Takeaways
- Utilize browser DevTools to optimize CSS animation performance; they can help identify issues causing choppy animations and provide insight into what’s happening under the hood. These tools can check the framerate, review, edit, and debug code, and analyze layout and paint operations that can impact performance.
- Aim for animations to hit 60 fps (frames per second) for fluidity. To ensure smoother animations, only animate CSS opacity, transforms, and filters. Animating other properties can put browsers under pressure to perform costly tasks in very little time, leading to poor results.
- Use the will-change CSS property, or the translateZ(0) and translate3d(0,0,0) hacks to force the browser to hand over the work of changing some properties to the GPU (Graphical Processing Unit). This takes advantage of hardware acceleration and relieves the browser’s main thread of some pressure. However, overuse can lead to the very issues you’re trying to avoid, such as janky animations.
Developer Tools for CSS Performance
Your animations need to hit 60 fps (frames per second) to run fluidly in the browser. The lower the rate, the worse your animation will look. This means the browser has no more than about 16 milliseconds to do its job for one frame. But what does it do during that time? And how would you know if your browser is keeping up with the desired framerate?
I think nothing beats user experience when it comes to assessing the quality of an animation. However, developer tools in modern browsers, while not always 100% reliable, have been getting smarter and smarter, and there’s quite a bit you can do to review, edit and debug your code using them.
This is also true when you need to check framerate and CSS animation performance. Here’s how it works.
Exploring the Performance Tool in Firefox
In this article I use the Firefox Performance tool. The other big contender is the Chrome Performance Tool. You can pick your favorite, as both browsers offer powerful performance features.
To open the developer tools in Firefox, choose one of these options:
- Right-click on your web page and choose Inspect Element in the context menu
- If you use the keyboard, press Ctrl + Shift + I on Windows and Linux or Cmd + Opt + I on macOS.
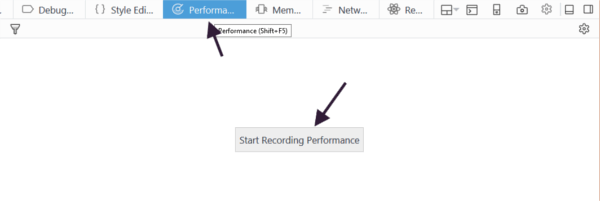
Next, click on the Performance tab. Here, you’ll find the button that lets you start a recording of your website’s performance:
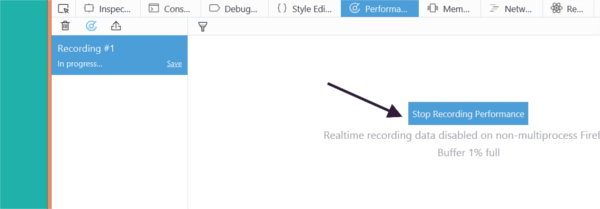
Press that button and wait for a few seconds or perform some action on the page. When you’re done, click the Stop Recording Performance button:
In a split second, Firefox presents you with tons of well-organized data that will help you make sense of which issues your code is suffering from.
The result of a recording inside the Performance panel looks something like this:
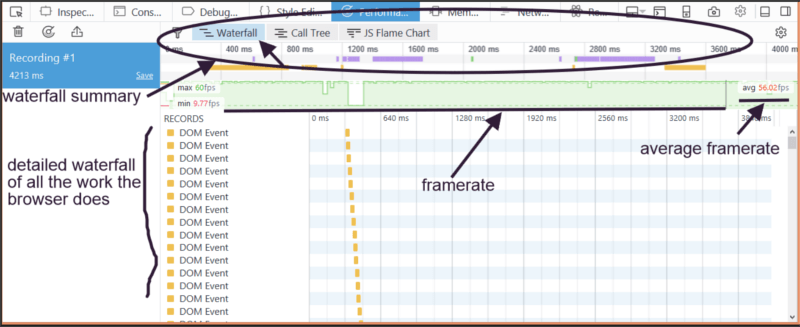
The Waterfall section is perfect for checking issues related to CSS transitions and keyframe animations. Other sections are the Call Tree and the JS Flame Chart, which you can use to find out about bottlenecks in your JavaScript code.
The Waterfall has a summary section at the top and a detailed breakdown. In both, the data is color-coded:
- Yellow bars refer to JavaScript operations.
- Purple bars refer to calculating HTML elements’ CSS styles (recalculate styles) and laying out your page (layout). Layout operations are quite expensive for the browser to perform, so if you animate properties that involve repeated layouts (also known as reflows — such as
margin,padding,top,left, etc. — the results could be janky. - Green bars refer to painting your elements into one or more bitmaps (Paint). Animating properties like
color,background-color,box-shadow, etc., involves costly paint operations, which could be the cause of sluggish animations and poor user experience.
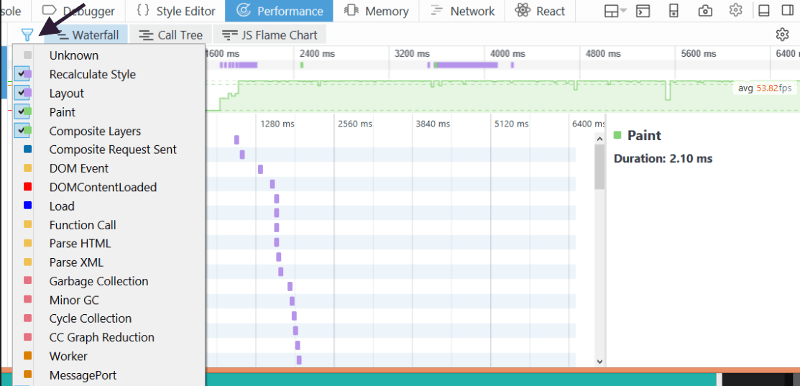
You can also filter the type of data you want to inspect. For instance, I’m interested only in CSS-related data, so I can deselect everything else by clicking on the filter icon at the top left of the screen:
The big green bar below the Waterfall summary represents information on the framerate.
A healthy representation would look quite high, but most importantly, consistent — that is, without too many deep gaps.
Let’s illustrate this with an example.
The Performance tool in action
This is a simple CSS animation using the @keyframes keyword. The test page looks like this:
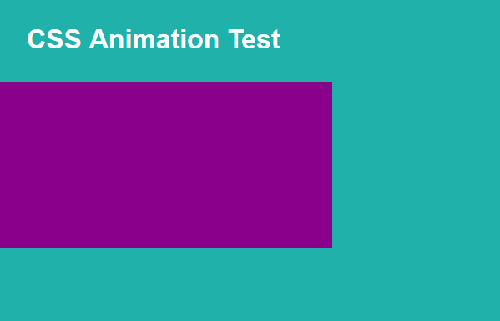
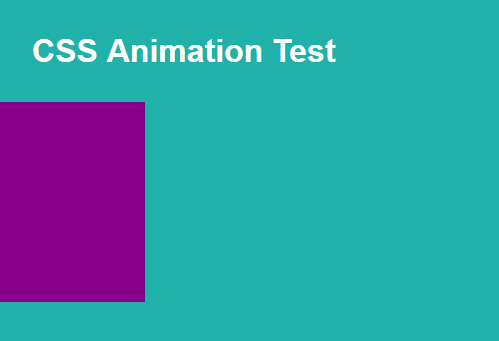
The rectangular purple box slides in and out of view in an infinite cycle.
I’ve done this by animating the margin-left property of the <div> element that represents the rectangular box on the screen. Here’s what the @keyframes animation block looks like:
@keyframes slide-margin {

  100% {

    margin-left: 0;

  }

}
The performance data I get from this animation looks like this:
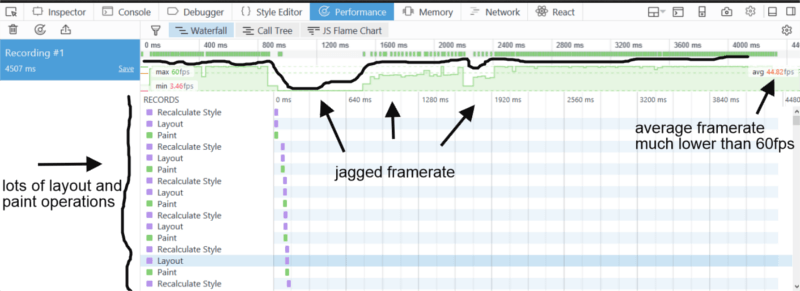
The framerate visual looks a bit jagged and the framerate is an average of 44.82 fps, which is a bit low.
Also, notice all the layout and paint operations that take place during the animation. These are costly operations the browser performs on its main thread, which has a negative impact on performance.
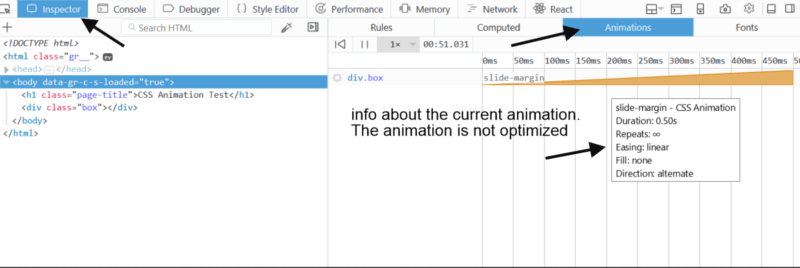
Finally, if you access the Inspector tool, click in the Animation section and hover over the animation name, an information box pops up with all the relevant data about the current animation. If your animation were optimized, there would be a message stating the fact. In this case, there is no message:
Now, I’m going to change my code and make a new recording as the browser animates the CSS translate3d() property using this @keyframes block:
@keyframes slide-three-d {

  100% {

    transform: translate3d(0, 0, 0);

  }

}
This is what the recording of the performance looks like:
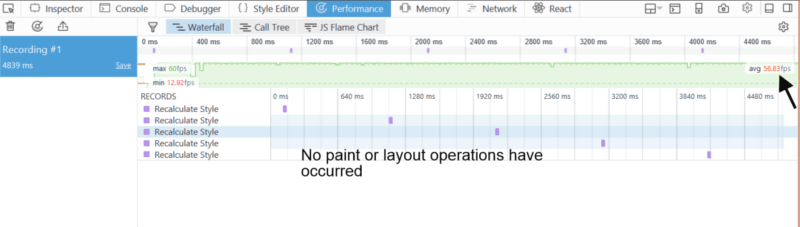
Now the framerate is higher (56.83 fps) and the waterfall is showing no costly layout and paint operations.
Also, if you open the Inspector tab of the developer tools, access the Animation panel and hover the mouse over the name of the animation, you can see something like this:
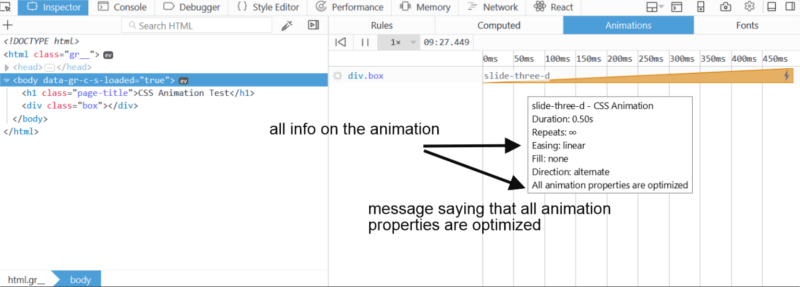
The info box relative to the animation name states that all animations are optimized, which is good news for your website visitors.
Only Animate CSS Opacity, Transforms and Filters
You’ve probably heard this piece of advice before, but just in case, it’s worth going over it again: if you want your animations to run smoothly, animate only CSS opacity, transforms and filters. Animating everything else will put your browser under pressure to perform costly tasks in very little time, which often doesn’t yield the best results.
As the Performance tool in your browser confirms, repeated layout and paint operations are not your friend.
However, each browser handles CSS properties a bit differently. If you want to know exactly which browser triggers layout and paint operations for which properties (especially when updating values for those properties, which is what is involved in web animation), head over to CSS Triggers.
To ensure performant animations, a popular approach is to force the browser to hand over the work of changing some properties to the GPU (Graphical Processing Unit), which relieves the browser’s main thread of some pressure and takes advantage of hardware acceleration. You can do so by using the will-change CSS property, or the translateZ(0) and translate3d(0,0,0) hacks. All of these tricks will work, but if you overdo it you could actually get exactly what you’re trying to avoid, i.e., janky animations.
I’m not going into the details of hardware acceleration for web animation performance, but if you’d like to dig deeper, take a look at the resources listed below.
Resources
- High Performance Animations by Paul Lewis and Paul Irish
- CSS animations and transitions performance: looking inside the browser by Max Vujovic
- Animations and Performance by Paul Lewis and Sam Thorogood
- Stick to Compositor-Only Properties and Manage Layer Count by Paul Lewis
- Tricks for GPU Composited CSS by Sara Soueidan
- An Introduction to the CSS will-change Property by Nick Salloum
- Animating CSS properties by MDN
Frequently Asked Questions (FAQs) on CSS Animation Performance
What are the key factors that affect CSS animation performance?
The performance of CSS animations is influenced by several factors. The complexity of the animation, the number of elements being animated, and the properties being animated all play a role. Animating properties like transform and opacity tend to be more performant as they don’t trigger layout or paint operations. However, animating properties like width, height, or margin can cause layout shifts and repaints, which can slow down the animation. Additionally, the device’s hardware and the browser’s rendering engine can also impact the performance of CSS animations.
How can I measure the performance of my CSS animations?
You can measure the performance of your CSS animations using browser developer tools. In Chrome, for example, you can use the Performance tab to record and analyze the runtime of your animations. This tool provides a detailed breakdown of where time is spent during the animation’s lifecycle, helping you identify any performance bottlenecks.
What is the ideal frame rate for smooth CSS animations?
The ideal frame rate for smooth animations is 60 frames per second (fps). This is because most devices refresh their screens 60 times per second. Therefore, to create a smooth animation, you should aim to update your animation every 16.67 milliseconds (1 second / 60), which corresponds to 60 fps.
How can I optimize my CSS animations for better performance?
There are several strategies to optimize CSS animations for better performance. One common approach is to animate properties that don’t trigger layout or paint operations, such as transform and opacity. Additionally, reducing the number of elements being animated and simplifying the animation can also improve performance. Using the will-change property can also help the browser to optimize animations by hinting at what properties are likely to be animated.
What is the difference between CSS and JavaScript animations in terms of performance?
CSS animations are generally more performant than JavaScript animations. This is because CSS animations are run on the browser’s rendering engine, separate from the main JavaScript thread. This means that even if the JavaScript thread is busy, the CSS animation can still run smoothly. However, JavaScript animations offer more control and flexibility, which can be beneficial for complex animations.
How does hardware acceleration impact CSS animation performance?
Hardware acceleration can significantly improve the performance of CSS animations. When hardware acceleration is enabled, the browser offloads some of the rendering tasks to the device’s GPU, freeing up the CPU to handle other tasks. This can result in smoother animations, especially for complex animations or animations involving a large number of elements.
What is the role of the requestAnimationFrame function in animation performance?
The requestAnimationFrame function is a JavaScript method that allows for more efficient animations by calling a specified function before the next repaint. This means that the animation can be synced with the device’s refresh rate, leading to smoother animations. It also allows the browser to optimize the animation, reducing CPU usage and improving performance.
How can I use the DevTools’ Performance panel to improve my CSS animation performance?
The Performance panel in DevTools provides a detailed breakdown of where time is spent during the animation’s lifecycle. By analyzing this data, you can identify any performance bottlenecks and optimize your animation accordingly. For example, if a large amount of time is spent painting, you might consider animating properties that don’t trigger paint operations.
What is the impact of layout thrashing on CSS animation performance?
Layout thrashing occurs when the browser has to repeatedly calculate layout information due to changes in the DOM. This can significantly impact the performance of CSS animations, causing them to run slowly or appear janky. To avoid layout thrashing, try to batch DOM read and write operations together and avoid animating properties that trigger layout operations.
How can I use the CSS will-change property to improve animation performance?
The will-change property allows you to inform the browser ahead of time about what properties you plan to animate. This allows the browser to perform any necessary optimizations before the animation begins, potentially leading to smoother animations. However, the will-change property should be used sparingly, as overuse can cause the browser to consume more resources and negatively impact performance.