This article was peer reviewed by Wern Ancheta, Scott Molinari, and Jeff Madsen. Thanks to all of SitePoint’s peer reviewers for making SitePoint content the best it can be!
By opening this article you’ve endeavored yourself to expanding your knowledge of PHP applications as part of event-based distributed systems. You’ll be given a quick intro into what we are referring to when we say event messages, what Logstash is, and why it is so cool.
If you’ve already heard of Beats or understand you can run Logstash locally to ship logs to another Logstash instance or directly to a datastore such as Elasticsearch, this article is still for you and will show you an easy-to-configure-and-run, hopefully more effective and certainly fun-to-use alternative.

Quick Intro into Event Messages and Logstash
With event messages, we gather information about events that occur in our applications, be it business-oriented decisions of the applications’ users, decisions made by the applications themselves, or their failures. Each event, besides the message it conveys, is typically determined by a timestamp and a type such as informational, warning or error. A record of an event is an event log.
Additionally, there’s also Event Sourcing – a somewhat different but also somewhat similar concept which you may want to check out.
There are many tools built specifically for the purpose of shipping logs to datastores for later analysis and making knowledge-based decisions. Logstash is one of them, and because of the vast number of input, output, codec and filter plugins it offers, the most popular. Out of the box, it can read from Heroku app logs, GitHub webhooks or Twitter Streaming API, create new events and send them to Graylog, IRC, or JIRA.
The event messages would ordinarily be of interest to the users of your applications, too. In an application, one page would generate events and another one would display them in an aggregated form.
Let’s consider an example where the first page publishes new blog posts and the other one lists all blog posts related to PHP that have been published in the last month. The application could have talked to a relational database directly for both read and write. But with event messages it is decoupled from the database so other subscribers can be added easily, e.g. an email list or a more performant datastore like Elasticsearch.
Publishing Events
For quick comparison, let’s first consider event publishing on Linux with Rsyslog, the favorite syslog of many computer systems.
Running this simple oneliner will write “Hello Wold!” to syslog.
php -r "openlog('greeting', LOG_NDELAY, LOG_USER); syslog(LOG_INFO, 'Hello World!');"
Since both Rsyslog and Logstash use RELP, a TCP based protocol for reliable delivery of event messages, sending that message to Logstash requires adding only two short statements to the Rsyslog configuration file.
$ModLoad omrelp
if $source == 'PHP-5.5.37' then :omrelp:centralserv:2514
provided that Logstash is listening on centralserv, port 2514.
In this example, we are also filtering messages by source so that only those made with our PHP will be sent over.
We won’t be giving you more details here. This is not supposed to be that kind of party. Instead, let’s switch over to Windows for a while. We’ll give you step-by-step instructions on how to do the same thing from there.
But just in case you want to learn more about this Linux setup, here are two quality links.
Publishing Events on Windows
We’ll be getting instructional at this point. Find yourself a Windows box and run the oneliner from before in the Command Prompt. PHP is cross-platform. This time, it means the greeting is recorded by the Windows Event Log service and you are able to see it in the Event Viewer.
Event Viewer can be found from the Cortana Search box. Alternatively, press Windows key + R to open the Run box, type eventvwr and click OK to open the Event Viewer.
Once the Event Viewer is open, expand Windows Logs in the Console Tree view on the left, click on the Application and scroll down the displayed logs at the central part of the window if necessary to reach the log you previously made.
At this point you should be getting something like this:

Level Information matches the first argument LOG_INFO we’ve passed into the syslog() call and the Source PHP-5.5.37 matches the version of the PHP CLI we ran (update to match yours). Knowing this, you may also want to filter the Application log or create a Custom View by clicking on the corresponding actions from the Actions Pane to the right.
Note: If you are also seeing a message like this:
The description for Event ID 2 from source PHP-5.5.37 cannot be found.
then your PHP installation did not add the required information to the Windows Registry so you have to do it manually. Download /win32/syslog.reg from the PHP source repository, open it in a text editor, adjust the PHP version and the path to the dll file e.g. change key name from HKEY_LOCAL_MACHINE\SYSTEM\CurrentControlSet\Services\EventLog\Application\PHP-5.3.99-dev to HKEY_LOCAL_MACHINE\SYSTEM\CurrentControlSet\Services\EventLog\Application\PHP-5.5.37 and EventMessageFile value from g:\\test\\srctrunkinstall\\php7ts.dll to C:\\xampp\\php\\php5ts.dll and import the key into the registry by double-clicking the file icon.
Streaming Event Messages to Logstash with Rsyslog Windows Agent
The remaining step is to stream such messages to the Logstash. We will show you how to do it with the Rsyslog Windows Agent, a Windows service that comes from the creators of Rsyslog and RELP. The agent will automatically monitor the Event Log and let you define rules and actions.
Download the agent from here, install it, then run the Configuration Client that comes with the service in order to tell the service which messages to send and where to.
Filters
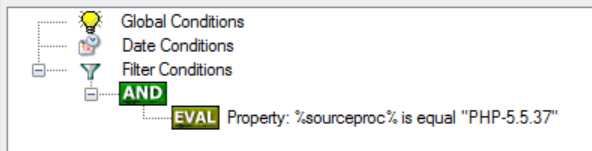
We are going to send only messages generated by PHP, so, once the Configuration Client is open, go to the filters dialog by clicking on the Filters label in the tree view on the left side of the window. Click on the AND node of the central tree view, that’s the graphical representation of the boolean expression we are going to make.
Now click on Add Filter > button on the right. From the dropdown menus choose Add Filter > > Event Log Monitor V2 > Event Source. Click to focus the newly created expression and in the Details tab below change Compare Operation from contains to is equal and in the Set Property Value field type the source name of your logs. In our example, it’s PHP-5.5.37.
We’ve made a rule. Next, we are going to create an action.
Actions
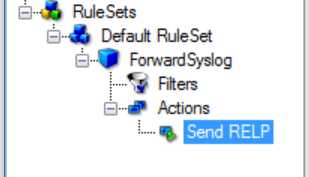
Remove the default action under the Actions label in the tree view on the left by right-clicking on it, then selecting Delete Action from the dropdown menu. Then, add a new action by right-clicking on the Actions label and choosing Add Action > Send RELP from the context menu.
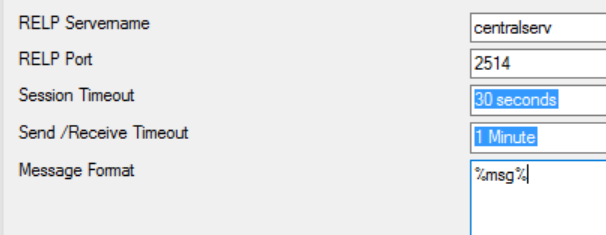
Now that the Send RELP action is focused, you are able to set RELP Servername and RELP Port. Also, as a start, change Message Format to %msg%. This will pass the messages to the RELP server just as they are, without modifying them.
Starting the Service & Debugging
There’s only one more thing to do: click on the blue triangle to start the service. From this point onward the messages should be flying over to Logstash and you won’t even have to start the service on the next Windows boot, it will start up automatically.
While you are confirming the setup really works, it’s good to know that the agent emits an error message on its own in case a message, your application’s message, could not be received by the RELP server. You can see the service messages as you would expect in the Event Viewer, but also by clicking on the Service Events node of the tree view on the left side of the Configuration Client window.
Conclusion
By now you’ve gained a basic understanding of what Logstash and Rsyslog are, learned that they can be used to make an event-based distributed system and acquired some hands-on experience.
And now let’s hear what you have to say. Do you develop on Windows and use Logstash in production or have interest in using it now? Great! We’d also love to hear about your use cases or questions in the comments below.
References
- How Logstash Works
- 5 Logstash Alternatives
- Reliable Event Logging Protocol
- relp | Logstash Reference [5.0] | Elastic
- Event Logging (Windows)
- Rsyslog
- About Rsyslog Windows Agent
- PHP :: Bug #72806 :: syslog issue with Event Viewer
Frequently Asked Questions (FAQs) about Sending PHP Event Messages to Remote Logstash on Windows
How can I install Logstash on Windows for PHP event messages?
Installing Logstash on Windows for PHP event messages involves a few steps. First, you need to download the Logstash zip file from the official Elastic website. After downloading, extract the zip file to a location of your choice. Then, navigate to the bin directory in the extracted folder and run Logstash from the command line. You can then configure Logstash to receive PHP event messages by creating a configuration file with input, filter, and output sections. The input section specifies the source of the event messages, the filter section processes the messages, and the output section determines where Logstash sends the processed messages.
What is the role of Elasticsearch in sending PHP event messages to remote Logstash?
Elasticsearch plays a crucial role in the process of sending PHP event messages to remote Logstash. It acts as a search and analytics engine where Logstash stores the processed event messages. Elasticsearch allows you to search and analyze these messages in real-time, making it easier to monitor and troubleshoot your PHP applications. You can also use Elasticsearch to create visualizations and dashboards of your data using Kibana, a visualization tool that integrates with Elasticsearch.
How can I send PHP app logs directly to the ELK service?
To send PHP app logs directly to the ELK (Elasticsearch, Logstash, Kibana) service, you need to configure your PHP application to log events to a specific location that Logstash monitors. You can do this by using a logging library like Monolog, which supports various log handlers, including files and sockets. After setting up the logging, you need to configure Logstash to read the logs from the specified location and send them to Elasticsearch. Finally, you can use Kibana to visualize and analyze the logs.
How can I use the PHP Event extension?
The PHP Event extension is a wrapper for the libevent library, which provides a mechanism to execute a callback function when a specific event occurs or after a set time period. To use this extension, you need to install it via PECL, an installer for PHP extensions. After installing, you can use the Event class and its methods to create and manage events. For example, you can use the Event::add method to schedule an event, and the Event::set method to prepare an event.
What are some common Logstash configuration examples for PHP?
Logstash configurations for PHP typically involve setting up an input source, a filter for processing, and an output destination. For example, you can configure Logstash to read PHP logs from a file, filter them using the grok filter plugin to parse and structure the logs, and output them to Elasticsearch. Another common configuration is to set up Logstash to receive logs from a PHP application via a TCP or UDP socket, process them, and send them to a remote Elasticsearch instance.
How can I handle errors when sending PHP event messages to remote Logstash?
Handling errors when sending PHP event messages to remote Logstash involves monitoring your PHP application and Logstash for any issues. You can use the error_log function in PHP to log any errors to a file or a remote logging server. In Logstash, you can use the stdout output plugin to print events to the console, which can help in debugging. Additionally, you can set up alerts in Elasticsearch or Kibana to notify you when certain error conditions occur.
Can I use Logstash with other programming languages besides PHP?
Yes, Logstash is a versatile data processing tool that can be used with various programming languages, not just PHP. It can process logs and events from applications written in languages like Java, Python, Ruby, and more. The key is to configure your application to log events in a format that Logstash can understand, such as JSON or plain text, and to set up Logstash to read from the location where your application logs these events.
How can I secure my PHP event messages when sending them to remote Logstash?
Securing your PHP event messages when sending them to remote Logstash can be achieved in several ways. One method is to use SSL/TLS encryption for the communication between your PHP application and Logstash. This ensures that the event messages are encrypted in transit and cannot be intercepted by unauthorized parties. Another method is to use authentication and access control in Elasticsearch to prevent unauthorized access to the stored event messages.
How can I optimize the performance of Logstash when processing PHP event messages?
Optimizing the performance of Logstash when processing PHP event messages can involve several strategies. One is to use multiple worker threads in Logstash to process events in parallel. Another is to use batch processing to process multiple events at once, which can reduce the overhead of processing each event individually. You can also tune the JVM settings for Logstash, such as the heap size, to optimize memory usage.
Can I integrate Logstash with other monitoring and alerting tools?
Yes, Logstash can be integrated with various monitoring and alerting tools to provide a comprehensive monitoring solution for your PHP applications. For example, you can use the Logstash output plugins to send events to monitoring tools like Nagios or Graphite. You can also integrate Logstash with alerting tools like PagerDuty or Opsgenie to receive notifications when certain conditions are met in your event data.
 Luka Žitnik
Luka is a programmer who devotes much of his life and gratitude to people at TeleSign. He cheers for Web technologies and believes modesty is a virtue. Say hello to him at luka.zitnik@gmail.com.