- GDELT
- Online Experimenting
- GDELT Tools and APIs
- Concepts: the CAMEO Ontology
- Set up an Account for BigQuery
- Accessing the Data with PHP
- Exploring the Datasets
- A Little History
- The GDELT Datasets
- Is It Free?
- Querying in BigQuery
- Visualization
- A Word of Caution
- Conclusion
- Frequently Asked Questions about Using GDELT 2 with PHP to Analyze the World
Are you interested in political world events? Do you want to play with one of the world’s largest databases? If you answered either of those questions with a yes, keep reading – this will interest you!
This article follows up on the promise to use GDELT with PHP.
I will show you a simple example of how to use GDELT through BigQuery with PHP, and how to visualize the results on a web page. Along the way, I will tell you some more about GDELT.

GDELT
GDelt (the “Global Database of Events, Language and Tone”) is the biggest Open Data database of political events in the world. It was developed by Kalev Leetaru (personal website), based on the work of Philip A. Schrodt and others in 2011. The data is available for download via zip files and, since 2014, is query-able via Google’s BigQuery web interface and through its API, and with the GDELT Analysis Service. The GDELT Project:monitors the world’s broadcast, print, and web news from nearly every corner of every country in over 100 languages and identifies the people, locations, organizations, counts, themes, sources, emotions, quotes, images and events driving our global society every second of every day, creating a free open platform for computing on the entire world.
Online Experimenting
All GDELT data has been made available through BigQuery. This “big data” database has a web interface that allows you to view the table structures, preview the data, and make queries while making use of the autosuggest feature. In order to experiment with the GDELT dataset online, you need to have a Google account. Go to the BigQuery dashboard. If you don’t have a Google Cloud project yet, you will be prompted to create one. This is required. This project will be your working environment, so you may as well choose a proper name for it. You can create your own queries via “Compose query”. This one, for example:SELECT EventCode, Actor1Name, Actor2Name, SOURCEURL, SqlDate
FROM [gdelt-bq:gdeltv2.events]
WHERE Year = 2016
LIMIT 20
GDELT Tools and APIs
GDELT allows you to quickly create visualizations from within its website. Go to the analysis page, create a selection, and a link to the visualization will be mailed to you. GDELT has recently started to open up two APIs that allow you to create custom datafeeds from a single URL. These feeds can be fed directly into CartoDB to create a live visualization.- GKG GeoJSON creates feeds of the knowledge graph (tutorial)
- Full Text Search API creates feeds of news stories of the past 24 hours
Concepts: the CAMEO Ontology
In order to work with GDELT, you need to know at least some of the basic concepts. These concepts were created by Philip A. Schrodt and form the CAMEO ontology (for Conflict and Mediation Event Observations).- An Event is a political interaction of two parties. Its event code describes the type of event, i.e. 1411: “Demonstrate or rally for leadership change”.
- An Actor is one of the 2 participants in the event. An actor is either a country (“domestic”) or otherwise (“international”, i.e. an organization, a movement, or a company). Actor codes are sequences of one or more three-letter abbreviations. For example, each following triplet specifies an actor further. NGO = non governmental organisation, NGOHLHRCR (NGO HLH RCR) = non governmental organization / health / Red Cross.
- The Tone of an event is a score between -100 (extremely negative) and +100 (extremely positive). Values between -5 and 5 are most common.
- The Goldstein scale of an event is a score between -10 and +10 that captures the likely impact that type of event will have on the stability of a country.
Set up an Account for BigQuery
If you want to use BigQuery to access GDELT from within an application, you will be using Google’s Cloud Platform. I will tell you how to create a BigQuery account, but your situation is likely somewhat different from what I describe here. Google changes its user interface now and then. You will need a Google account. If you don’t have one, you have to create it. Then, enter your console where you will be asked to create a project if you don’t already have one. Check out the console. In the top left you’ll see a hamburger menu (an icon with three horizontal lines) that gives access to all parts of the platform. Using your project, go to the API library and enable the BigQuery API. Next, create a service account for your project and give this account the role of BigQuery User. This allows it to run queries. You can change permissions later on the IAM tab. For “member”, select your service account ID. Your service account allows you to create a key (via a dropdown menu), a JSON file that you download and save in a secure place. You need this key in your PHP code. Finally, you need to set up a billing account for your project. This may surprise you, since GDELT access is free for up to 1 Terabyte per month, but it is necessary, even though Google will not charge you for anything. Google provides a free trial account for 3 months. You can use it to experiment with. If you actually start using your application, you will need to provide credit card or bank account information.Accessing the Data with PHP
You would previously access BigQuery via the Google APIs PHP Client but now the preferred library is the Google Cloud Client Library for PHP. We can install it with Composer:composer require google/cloud
use Google\Cloud\BigQuery\BigQueryClient;

// setup Composer autoloading
require_once __DIR__ . '/vendor/autoload.php';

$sql = "SELECT theme, COUNT(*) as count
    FROM (
        select SPLIT(V2Themes,';') theme
        from [gdelt-bq:gdeltv2.gkg]
        where DATE>20150302000000 and DATE < 20150304000000 and AllNames like '%Netanyahu%' and TranslationInfo like '%srclc:heb%'
    )
    group by theme
    ORDER BY 2 DESC
    LIMIT 300
";

$bigQuery = new BigQueryClient([
    'keyFilePath' => __DIR__ . '/path/to/your/google/cloud/account/key.json',
]);

// Run a query and inspect the results.
$queryResults = $bigQuery->runQuery($sql);

foreach ($queryResults->rows() as $row) {
    print_r($row);
}
Exploring the Datasets
We can even query metadata. Let’s start with listing the datasets of the project. A dataset is a collection of tables.$bigQuery = new BigQueryClient([
'keyFilePath' => '/path/to/your/google/cloud/account/key.json',
'projectId' => 'gdelt-bq'
]);
/** @var Dataset[] $datasets */
$datasets = $bigQuery->datasets();
$names = array();
foreach ($datasets as $dataset) {
$names[] = $dataset->id();
}
print_r($names);
gdelt-bq) in the client configuration when querying metadata.
This is the result of our code:
Array
(
    [0] => extra
    [1] => full
    [2] => gdeltv2
    [3] => gdeltv2_ngrams
    [4] => hathitrustbooks
    [5] => internetarchivebooks
    [6] => sample_views
)
A Little History
Political events data has been kept for decades. An important milestone in this field was the introduction of the Integrated Crisis Early Warning System (ICEWS) program around 2010. An interesting and at times amusing overview of global events data acquisition written by Philip A. Schrodt is Automated Production of High-Volume, Near-Real-Time Political Event Data. News stories are continuously collected from a wide range of sources, such as AfricaNews, Agence France Presse, Associated Press Online, BBC Monitoring, Christian Science Monitor, United Press International, and the Washington Post. The data is gathered from several sources of news stories. These used to be hand coded, but is now done by a variety of natural language processing (NLP) techniques. GDELT 1 parsed the news stories with a C++ library called TABARI and fed the coded data to the database. TABARI parses articles using a pattern-based shallow parser and performs Named Entity Recognition. It currently covers the period from 1979 to present day. An early introduction of GDELT by Leetaru and Schrodt, describing news sources and coding techniques can be read here. In February 2015, GDELT 2.0 was released. TABARI was replaced by the PETRARCH library (written in Python). The Stanford CoreNLP parser is now used, and articles are translated. If you want to read more about the reasons behind this change, you can read the very enlightening Philip A. Schrodt’s slides about it. GDELT 2 also extends the event data with a Global Knowledge Graph. In September 2015 data from the Internet Archive and Hathi Trust was incorporated into the GDELT BigQuery database.The GDELT Datasets
An overview of the datasets is on this page of The GDELT Project website. The datasets are grouped like this:- The original GDELT 1 dataset: full. Check this blog for an example by Kalev Leetaru.
- The GDELT 2 datasets: gdeltv2 and gdeltv2_ngrams
- The Hathi Trust Books dataset: hathitrustbooks
- The Internet Archive dataset: internetarchivebooks. This page shows an example query on book data from the Internet Archive
Is It Free?
Above 1 TB, Google charges $5 per TB. When I heard that the first Terabyte of processed data per month is free, I thought: 1TB of data should be enough for anyone! I entered by own bank account information, and placed a couple of simple queries. A week later, when a new month had begun, I got a message from Google Cloud:“We will automatically be billing your bank account soon”I was charged for € 10.96! How did that happen? This is when I looked a little closer at pricing. Google Cloud’s page on pricing is quite clear actually. In the context of querying GDELT, you don’t pay for loading, copying, and exporting data. Nor do you pay for metadata operations (listing tables, for example). You just pay for queries. To be precise:
Query pricing refers to the cost of running your SQL commands and user-defined functions. BigQuery charges for queries by using one metric: the number of bytes processed.It’s not the size of the query, nor the size of the result set (as you might presume), but the size of the data pumped around by BigQuery while processing it. Looking at my billing dashboard I saw that Google had charged me for
BigQuery Analysis: 3541.117 Gibibytes
$results = $bigQuery->runQuery($sql);
$info = $results->info();

$tb = ($info['totalBytesProcessed'] / Constants::BYTES_PER_TEBIBYTE); // 1099511627776
$cost = $tb * Constants::DOLLARS_PER_TEBIBYTE; // 5
Querying in BigQuery
The lower part of the page on billing is very informative. It teaches us that BigQuery loads a full column of data each time it needs but a single record of it. So for instance, I ran:SELECT Actor1Name
FROM [gdelt-bq:gdeltv2.events]
WHERE GLOBALEVENTID = 526870433
Visualization
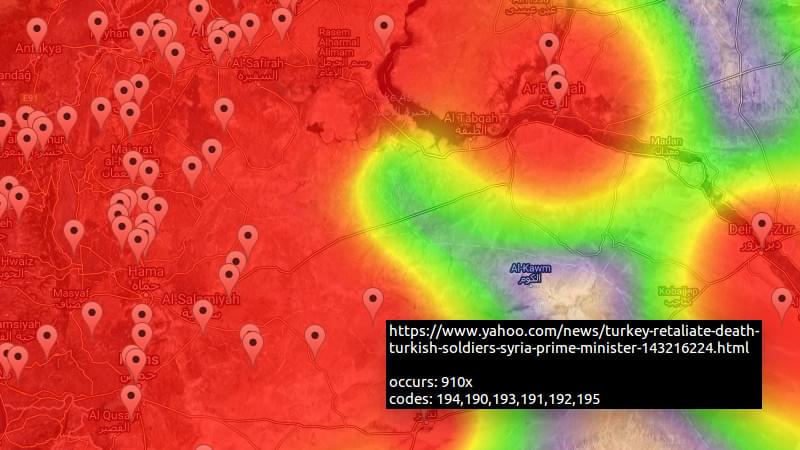
When I was writing this article, I thought about the added value a scripted approach to GDELT might have. I think it is in the fact that you have complete control over both the query and the visualization! Being not too inventive myself, I decided to create a graph of all fights that have been reported in the past two days, just as an example. GDELT helps you create fancy visualizations, but there is no API for them. However, the website does show us what tools they were made with. We can use the same tools to create the graphs ourselves. I picked the heat map because it best expressed my intent. In the Output section I found out it used heatmap.js to generate an overlay over Google Maps. I copied the code fromheatmap.js into my project, and tweaked it to my needs.
An API key is required to use Google Maps. You can get one here.
I placed the code for the GDELT fights heat map example on Github.
 The query selects geographical coordinates of all “fight” events (the 190 series of event codes) added between now and two days ago and groups them by geographical coordinates. It takes only root events, in an attempt to filter the relevant from the irrelevant. I also added SOURCEURL to my select. I used this to create clickable markers on the map, showing at a deeper zoom level, that allow you to visit the source article of the event.
SELECT MAX(ActionGeo_Lat) as lat, MAX(ActionGeo_Long) as lng, COUNT(*) as count, MAX(SOURCEURL) as source, GROUP_CONCAT(UNIQUE(EventCode)) as codes
FROM [gdelt-bq:gdeltv2.events]
WHERE SqlDate > {$from} AND SqlDate < {$to}
AND EventCode in ('190', '191','192', '193', '194', '195', '1951', '1952', '196')
AND IsRootEvent = 1
AND ActionGeo_Lat IS NOT NULL AND ActionGeo_Long IS NOT NULL
GROUP BY ActionGeo_Lat, ActionGeo_Long
 As for the costs? This example query takes only several gigabytes to process. Because it is cached, it needs to be executed once a day at most. This way, it stays well below the 1TB limit and it doesn’t cost me a penny!
A Word of Caution
Be careful about naive use of the data that GDELT provides.- Just because the number of events of a certain phenomenon increases as the years progress, does not mean that the phenomenon increases. It may just mean that more data has become available, or that more sources respond to the phenomenon.
- The data is not curated, no human being has selected the relevant pieces from the irrelevant.
- In many instances the actors are unknown.
Conclusion
GDELT certainly provides a wealth of information. In this article, I’ve just scratched the surface of all the ideas, projects and tools that it contains. The GDELT website provides several ways to create visualizations without having to code. If you like coding, or you find that the available tools are insufficient for your needs, you can follow the tips shown above. Since GDELT is accessible through BigQuery, it is easy to extract the information you need using simple SQL. Be careful, though! It costs money to use BigQuery, unless you prepare your queries well and use caching. This time, I merely created a simple visualization of a time-dependent query. In practice, a researcher needs to do a lot more tweaking to get exactly the right results and display them in a meaningful way. If you were inspired by this article to create a new PHP application, please share it with us in the comments section below. We’d like to know how GDELT is used around the world. All code from this post can be found in the corresponding Github repo.Frequently Asked Questions about Using GDELT 2 with PHP to Analyze the World
How can I get started with GDELT 2 and PHP for data analysis?
To get started with GDELT 2 and PHP for data analysis, you first need to have a basic understanding of PHP and how to use it for data manipulation. Once you have this, you can then proceed to download and install the GDELT 2 API. This API is the tool that will allow you to access and analyze the vast amount of data that GDELT 2 has to offer. After installing the API, you can then start writing PHP scripts that will use the API to fetch and analyze data.
What kind of data can I analyze with GDELT 2 and PHP?
GDELT 2 offers a vast amount of data that you can analyze. This includes data on global events, news coverage, and even television broadcasts. The data is categorized into various themes, locations, and timeframes, allowing you to perform a wide range of analyses. For instance, you can analyze the frequency of certain themes in news coverage over a specific period or compare the coverage of different locations.
How can I use the GDELT 2 API with PHP?
To use the GDELT 2 API with PHP, you need to write PHP scripts that make HTTP requests to the API. These requests will fetch data from the API, which you can then manipulate and analyze using PHP. The API offers various endpoints that you can use to fetch different types of data. For instance, the ‘events’ endpoint allows you to fetch data on global events, while the ‘mentions’ endpoint allows you to fetch data on news coverage.
Can I use GDELT 2 and PHP for real-time data analysis?
Yes, you can use GDELT 2 and PHP for real-time data analysis. The GDELT 2 API updates every 15 minutes, providing you with near real-time data. This allows you to perform real-time analyses, such as tracking the coverage of a certain event as it unfolds.
How can I filter the data I fetch from the GDELT 2 API?
The GDELT 2 API allows you to filter the data you fetch by various parameters. These include the timeframe, location, and theme of the data. To filter the data, you simply include the relevant parameters in your HTTP request to the API. For instance, to fetch data on events in a specific location, you would include the ‘location’ parameter in your request.
What are the limitations of using GDELT 2 and PHP for data analysis?
While GDELT 2 and PHP offer powerful tools for data analysis, they do have some limitations. For instance, the GDELT 2 API has a rate limit, which means you can only make a certain number of requests per minute. Additionally, while PHP is a powerful language for data manipulation, it may not be as efficient as other languages for large-scale data analysis.
Can I use GDELT 2 and PHP to analyze historical data?
Yes, you can use GDELT 2 and PHP to analyze historical data. The GDELT 2 API provides access to a vast amount of historical data, dating back to 1979. This allows you to perform historical analyses, such as tracking the coverage of a certain theme over several decades.
How can I visualize the data I analyze with GDELT 2 and PHP?
There are various ways you can visualize the data you analyze with GDELT 2 and PHP. One common method is to use a library like GD or ImageMagick to generate graphs and charts. You can also use libraries like Google Charts or D3.js to create interactive visualizations.
Can I use GDELT 2 and PHP for sentiment analysis?
Yes, you can use GDELT 2 and PHP for sentiment analysis. The GDELT 2 API provides data on the tone of news coverage, which you can analyze to gauge sentiment. This can be useful for various applications, such as tracking public sentiment towards a certain event or issue.
How can I troubleshoot issues with the GDELT 2 API and PHP?
If you encounter issues with the GDELT 2 API and PHP, there are several steps you can take. First, check the API documentation to ensure you are using the correct endpoints and parameters. If the issue persists, you can use PHP’s error handling functions to debug your code. You can also reach out to the GDELT community for help, as they are often willing to assist with troubleshooting.
 Patrick van Bergen
Patrick works as a Magento developer at BigBridge in the Netherlands. He is on a lifelong mission to find machine intelligence. He likes Natural Language Interaction, Open Data, and Computer Graphics.