Hello,
I am trying to add column graphs to a web page.
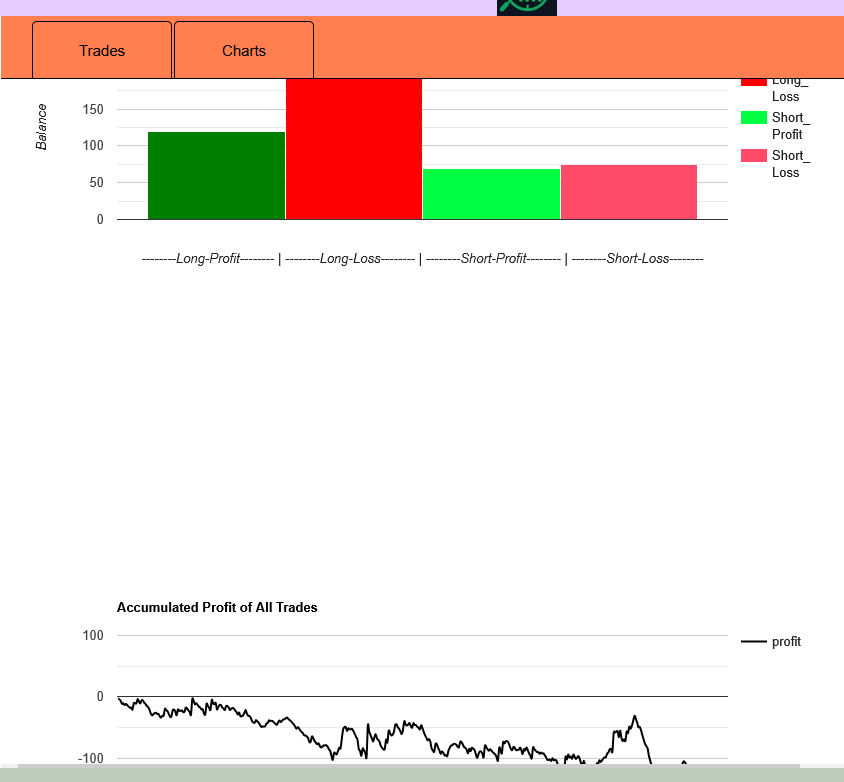
Here is how it looks on wamp server:

And here is how it looks on the host server:
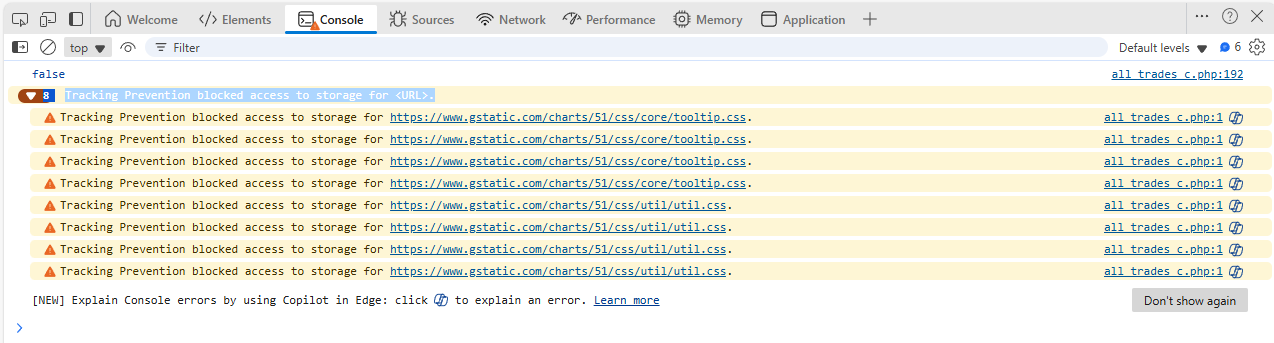
Here is a screenshot of page firefox console on host server

And here is firefox console of wamp server
Here is the functions code. The problem is in drawVisualization_bh() javascript function.
all_trades_c.inc.php (17.0 KB)
And Here is the code for javaScript libraries links:
<script type="text/javascript" src="https://www.gstatic.com/charts/loader.js"></script>
  <script type="text/css" src="js/jquery-ui.css"></script>
 <link rel="stylesheet" href="https://code.jquery.com/ui/1.13.2/themes/smoothness/jquery-ui.css">
<script src="https://code.jquery.com/jquery-3.6.4.min.js"></script>
<script src="https://code.jquery.com/ui/1.13.2/jquery-ui.min.js"></script>
<link rel="stylesheet" type="text/css" href="includes/basic.css?ver='301'
             media="screen" />
Where is the problem?
What is the solution ?
How is it that some functions work while others don’t ?