

The purpose of Shiny is to provide an intuitive and user-friendly interface to R. R is a highly popular statistical environment for doing heavy data analysis and constructing statistical models, and therefore is highly popular among data scientists. However, for a user with a non-coding background, using R to conduct such analysis can become quite intensive. This is where Shiny Web Apps come in. Essentially, Shiny allows for a more intuitive graphical user interface that is still capable of conducting sophisticated data analysis — without the need for extensive coding on the part of the end user.
In my article on using Shiny with R and HTML, I illustrated how an interactive web application can be created to conduct analysis without the need for direct manipulation of code. In this article, I’ll use a slightly different model to illustrate how the Shiny environment can be customized to work with the end user in a more intuitive fashion. Essentially, the goal of this article is to illustrate how a user can:
- Build an application by linking the UI and server side
- How to customize the themes available in the Shiny Themes library
- Implement error messages in order to provide guidance to an end user on how to use a particular program
The program itself that is developed for this tutorial is quite basic: a slider input allows the user to manipulate a variable within the program by means of reactivity, which causes instantaneous changes in the line plot output that is developed by means of reactivity.
This inherent function gives Shiny a significant advantage over using R code as a stand-alone. Traditionally, in order to analyze the change in a particular variable, the code must be manipulated directly (or the data from which the code is reading), and this can ultimately become very inefficient. However, Shiny greatly speeds up this process by allowing the user to manipulate the variables in a highly intuitive manner, and changes are reflected instantly.
However, the whole purpose of Shiny is to make an R Script as interactive as possible. In this regard, the user will want to be able to add features to the program that go well beyond reactivity. Two such aspects of this that I will discuss in this tutorial are:
- Using
shinythemesin order to customize the appearance of our Shiny appearance - Constructing a
validate()function in order to display an alert once variables are manipulated in a certain manner
Shiny Themes
In the UI of our original program, we did not specify a theme, and therefore ended up with quite a basic (default Bootstrap) view of our output:
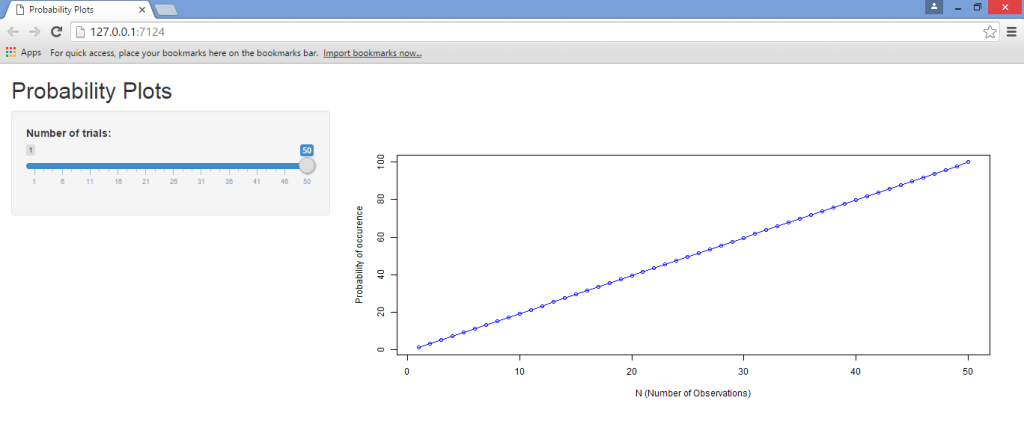
When we defined the shinyUI(fluidPage(…)) function, we didn’t specify a theme. In this instance, we’re going to specify several of the themes available from the Shiny Themes package.
After we’ve specified shinyUI(fluidPage(…)), we’re also specifying our theme as follows:
shinyUI(fluidPage(theme = shinytheme("cyborg")
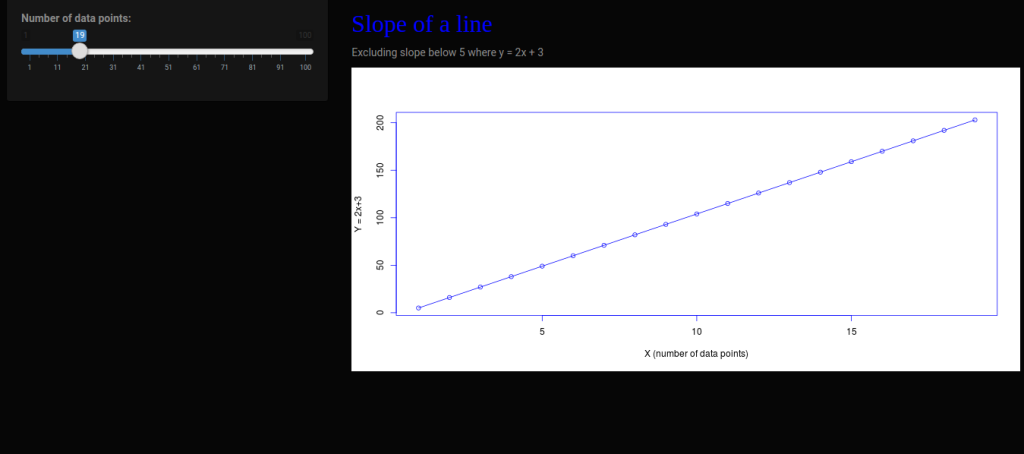
From the above, we see that selecting the Cyborg theme gives our web app a dark background. As another example, let’s now select the Spacelab theme and see what we come up with:
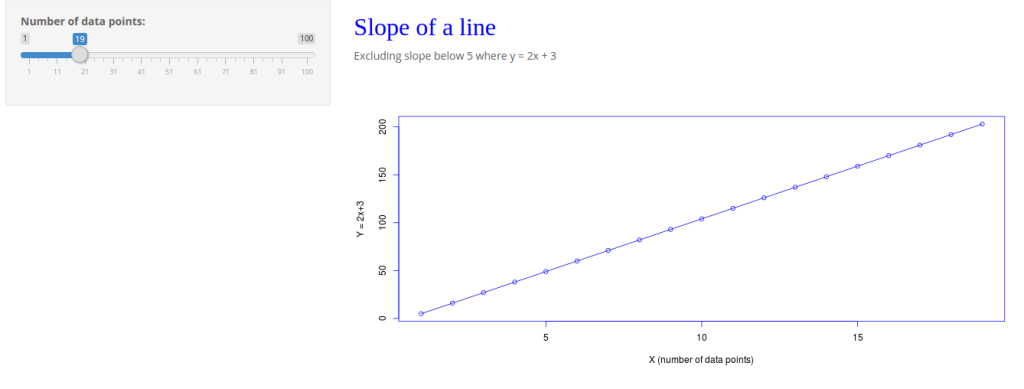
These themes demonstrate more levels of customization depending on the other attributes in the Shiny code, such as additional buttons, tabs, etc. Feel free to experiment with the other themes at the RStudio GitHub account and see what you come up with!
validate() function
The validate function is an indispensable tool when it comes to working with Shiny code. Essentially, validate allows for an alert message to be triggered when a certain part of the Shiny program is manipulated.
In this particular instance, I discuss how we can use the validate and need functions to trigger an alert message when we manipulate the slider in our program.
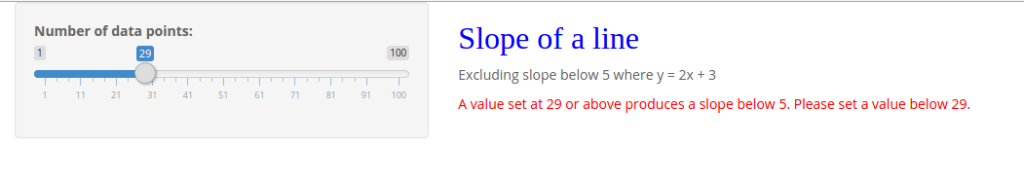
The program itself, as last time, is quite basic in terms of its function. Essentially, our Shiny program produces a value on the X-axis between 1 and 100 depending on that selected by the slider.
We are then using the corresponding y-value to produce an error message whenever the calculated slope falls below 5 — that is, at a value of 29 or greater. Note that the program is not calculating slope directly, but instead the user in this instance is using the value of 29 as the cutoff point for this slope based on manual calculation.
Within the user interface, we specify the validation trigger under our shinyUI as follows:
shinyUI(fluidPage(theme = shinytheme("spacelab"),
tags$head(
  tags$style(HTML("
    .shiny-output-error-validation {
    color: red;
    }
    "))
),
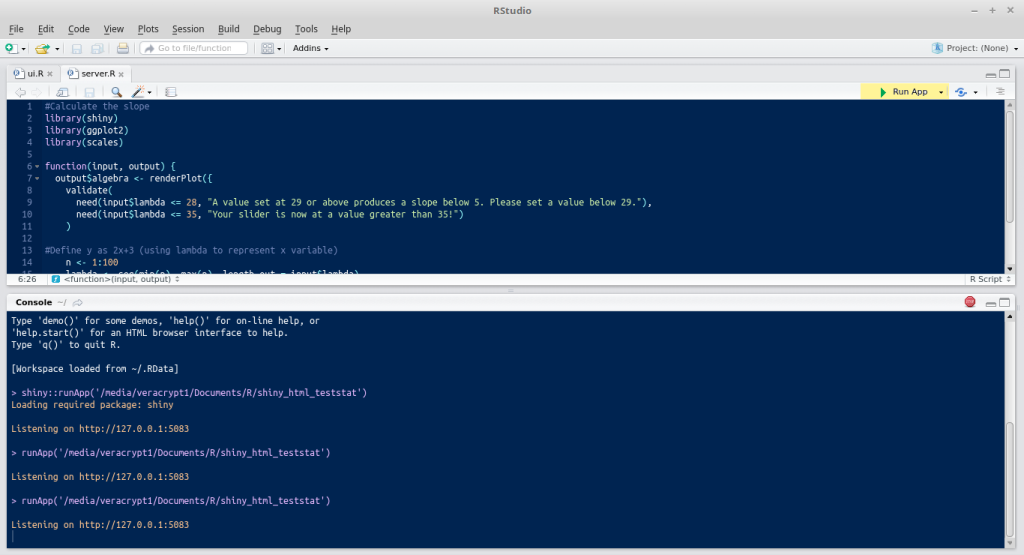
Under the server, we specify the validate and need commands under the input-output function:
function(input, output) {
  output$algebra < - renderPlot({
    validate(
      need(input$lambda <= 28, "A value set at 29 or above produces a slope below 5. Please set a value below 29.")
    )
Full Program Code
The UI and Server code as a whole is displayed below:
UI
#Load libraries
library(shiny)
library(shinythemes)


#Define Shiny theme and specify shiny-output-error-validation
shinyUI(fluidPage(theme = shinytheme("spacelab"),


tags$head(
  tags$style(HTML("
    .shiny-output-error-validation {
    color: red;
    }
    "))
),


sidebarLayout(
  sidebarPanel(
    sliderInput("lambda",
      "Number of data points:",
      min = 1,
      max = 100,
      value = 1)
),


mainPanel(
  h3("Slope of a line", style = "font-family: 'Jura'; color: blue; font-size: 32px;"),
  HTML("<p>Excluding slope below 5 where y = 2x + 3"),
  plotOutput("algebra")
)
)
))
Server
#Load libraries
library(shiny)
library(ggplot2)
library(scales)


#Define validate function
function(input, output) {
  output$algebra <- renderPlot({
    validate(
      need(input$lambda <= 28, "A value set at 29 or above produces a slope below 5. Please set a value below 29.")
    )


#Define y as 2x+3 (using lambda to represent x variable)
    n <- 1:100
    lambda <- seq(min(n), max(n), length.out = input$lambda)
    plot((2*lambda)+3, type = "o", col = 'blue',
         fg = 'blue', xlab= "X (number of data points)", ylab = "Y = 2x+3")
  })
}
As a quick recap, we run the program by:
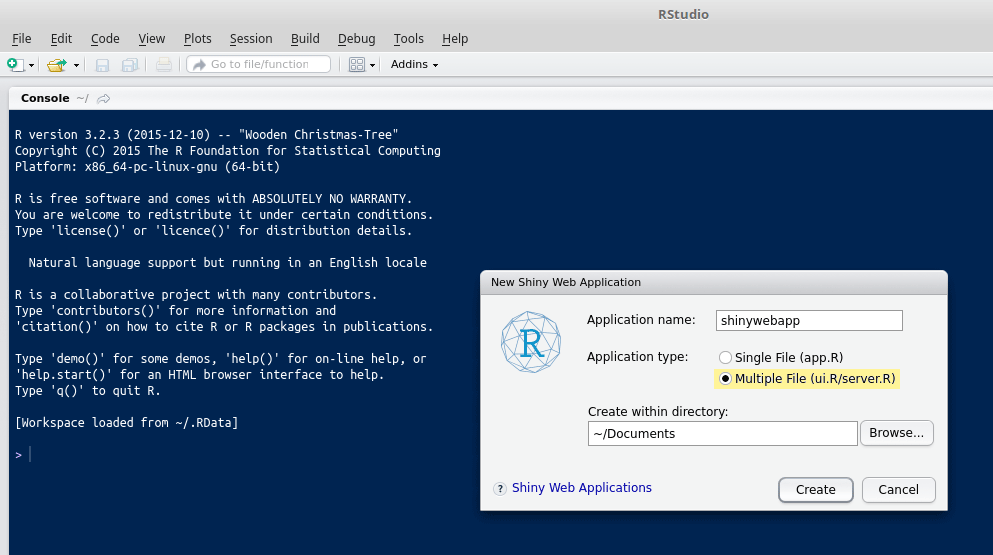
- Opening R Studio and selecting the New Icon → Shiny Web App
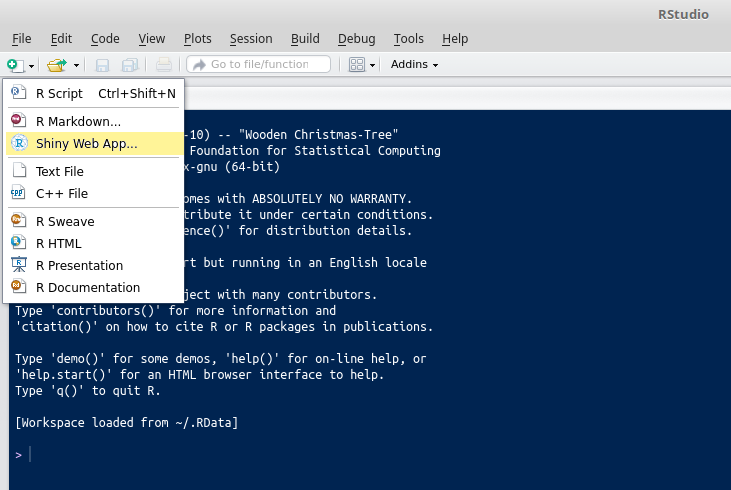
- We see that we then have an option to choose single file (with both
UI.Randserver.R), or a multiple file (whereUI.Randserver.Rare in separate scripts). We will use multiple file here.
- Now, we paste the above UI and server codes into their respective sections and run the program by selecting Run App.
We see that our line graph grows in data points on the x-axis depending on how we manipulate the slider. However, you’ll notice that once the slider is moved to a value of 29 or above, the error message is displayed, “A value set at 29 or above produces a slope below 5. Please set a value below 29”.
Displaying of such error messages can be highly useful when a developer wishes to direct an external user on the use of such a program. For instance, if it was the case that no error messages were to be displayed, then the user has free rein to make inputs into the program that might not necessarily be suitable. In this way, the developer can give further safeguards against inadvertent inputs by an external user, while doing this solely in R code leaves the inputs open to manipulation.
For instance, the Shiny website itself gives an example of how the validate function can also be applied to a list. The UI and server produce a histogram as output, but the program produces an error message when a particular dataset is selected in the list. In this way, the validate command does exactly that — validates a particular input, while the need function is what allows us to personalize the same by customizing our error message — that is, input$lambda <= 28, “A value set at 29 or above produces a slope below 5. Please set a value below 29.”
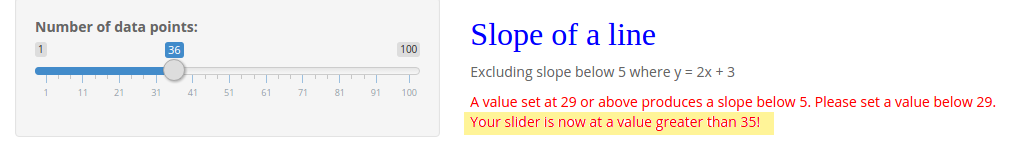
Moreover, while we only specified one error message, we could potentially specify multiple. For instance, let’s now suppose that we want to display an additional error message when the slider goes above a value of 35:
function(input, output) {
  output$algebra <- renderPlot({
    validate(
      need(input$lambda <= 28, "A value set at 29 or above produces a slope below 5. Please set a value below 29."),
      need(input$lambda <= 35, "Your slider is now at a value greater than 35!")
    )
Using an additional need function in the server code, manipulating the slider to a value above 35 means that we now display the additional error message, “Your slider is now at a value greater than 35!”
Conclusion
In this article, we’ve seen how to manipulate the design of our Shiny app using Shiny Themes, and learned how to apply filters to the parameters of our code and display error messages when certain conditions have been breached.
Ultimately, the focus of Shiny is in allowing for a far greater user-friendly and intuitive experience in conducting analysis than would be possible using R alone, and also minimizes risk of user input errors by properly specifying the parameters for a particular program.
Frequently Asked Questions (FAQs) on Shiny and R: Themes and Customizing Error Messages
How can I add a theme to my Shiny app in R?
Adding a theme to your Shiny app in R is a straightforward process. First, you need to install and load the shinythemes package. You can do this by running the following commands in your R console: install.packages("shinythemes") and library(shinythemes). Once the package is loaded, you can add a theme to your Shiny app by including the theme argument in your fluidPage or navbarPage function. For example, fluidPage(theme = shinytheme("cerulean")). This will apply the “cerulean” theme to your Shiny app.
Can I customize the error messages in my Shiny app?
Yes, you can customize the error messages in your Shiny app. Shiny provides a function called validate that you can use to check for certain conditions and display custom error messages when those conditions are not met. For example, if you have an input field where the user is supposed to enter a number and you want to display a custom error message when the input is not a number, you can do something like this: validate(need(is.numeric(input$myNumber), "Please enter a number")). This will display the message “Please enter a number” when the input is not a numeric value.
How can I change the color scheme of my Shiny app?
Changing the color scheme of your Shiny app can be done by using CSS. You can include a CSS file in your app by using the includeCSS function in your UI function. For example, includeCSS("styles.css"). In your CSS file, you can define the colors for different elements of your app. For example, to change the background color of your app to blue, you can include the following in your CSS file: body {background-color: blue;}.
Can I use custom fonts in my Shiny app?
Yes, you can use custom fonts in your Shiny app. This can be done by including a CSS file in your app and using the @font-face rule to define your custom font. For example, if you have a custom font file called “myFont.woff”, you can include the following in your CSS file: @font-face {font-family: "MyFont"; src: url("myFont.woff");}. Then, you can use the font in your CSS by setting the font-family property to “MyFont”.
How can I add a custom logo to my Shiny app?
Adding a custom logo to your Shiny app can be done by using the navbarPage function and including your logo as an argument. For example, navbarPage(title = "My App", windowTitle = "My App", tagList(tags$img(src = "myLogo.png", height = "50px", width = "50px"))). This will display your logo in the navbar of your app.
Can I use Bootstrap themes in my Shiny app?
Yes, you can use Bootstrap themes in your Shiny app. The shinythemes package provides several pre-made Bootstrap themes that you can use. You can also use custom Bootstrap themes by including the CSS file of the theme in your app.
How can I change the layout of my Shiny app?
Changing the layout of your Shiny app can be done by using the various layout functions provided by Shiny. For example, you can use the fluidRow and column functions to create a grid layout, or the sidebarLayout, sidebarPanel, and mainPanel functions to create a layout with a sidebar.
Can I use JavaScript in my Shiny app?
Yes, you can use JavaScript in your Shiny app. This can be done by including a JavaScript file in your app using the includeScript function, or by using the tags$script function to include inline JavaScript code.
How can I make my Shiny app responsive?
Making your Shiny app responsive can be done by using the fluidPage function for your UI. This function creates a layout that automatically adjusts to the size of the user’s screen. You can also use the responsive = TRUE argument in your navbarPage function to make the navbar responsive.
Can I use Shiny widgets in my app?
Yes, you can use Shiny widgets in your app. Shiny provides a variety of widgets, such as sliders, checkboxes, and text inputs, that you can use to create interactive elements in your app. You can add a widget to your app by including the corresponding function in your UI function. For example, sliderInput("mySlider", "My Slider", min = 0, max = 100, value = 50) will add a slider to your app.
 Michael Grogan
Michael Grogan is a data science consultant, with a profound passion for statistics and programming. He regularly utilizes programming languages such as Python, R and SQL to analyze a wide range of datasets, and also explores aspects of web development in designing interactive web apps for data science analytics. Find him at michaeljgrogan.com.