Debugging with Visual Studio Code: An Introduction
Let’s go back to your launch.json and add a postDebugTask. As your task is labeled echo, use echo here. Alternatively, you could apply the task as a preDebugTask.

If you run the debugger now, you’ll see that it prints hello to the terminal after ending the debugging session.
More information about all available options can be found via the VS Code documentation. You can find general debug documentation, and other documentation aimed specifically at Node.js development.
Navigating with Debugger
For this section, make sure to start the debugging session. The following sections describe each breakpoint toolbar icon in order, from left to right as shown in the screenshot below.
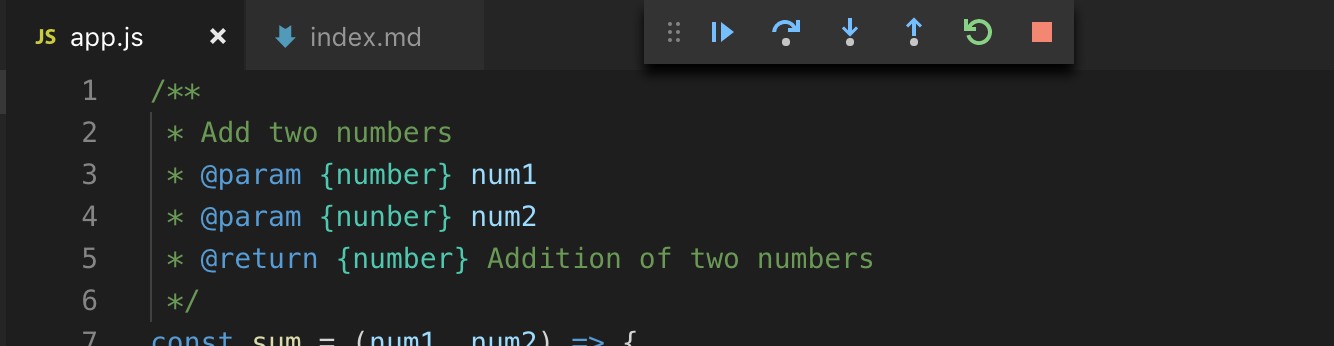
Continue Command
The Continue command is represented by the play icon, which allows you to continue to the next breakpoint.