hey @m_hutley this works for me and data is perfectly convert into an array of object

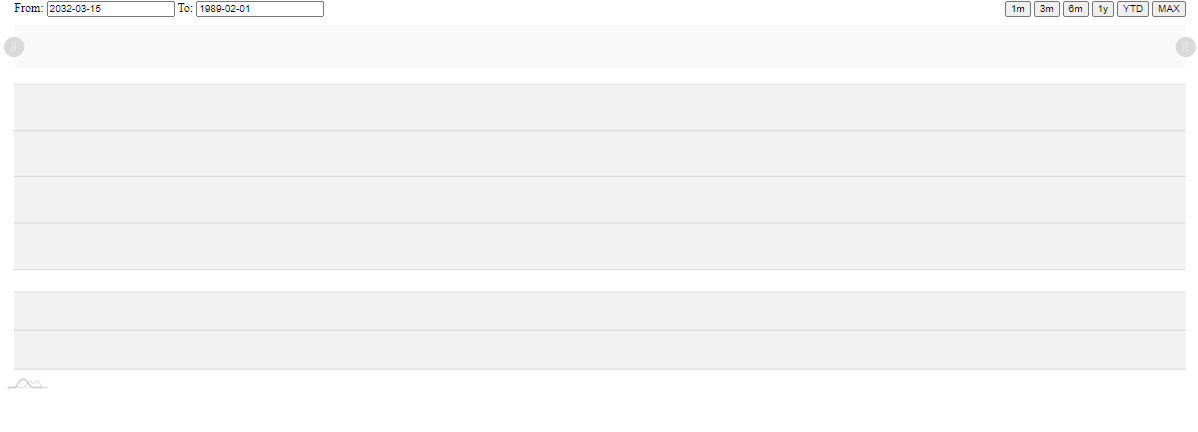
but I am facing an error to render candleStick chart with this data I’m trying to fix why map doesn’t render don’t know whats wrong with
Please take a look and let me know what wrong with it ?
here’s my code
   <script>

var output = [];

    $.get('https://www.alphavantage.co/query?function=TIME_SERIES_WEEKLY&symbol=IBM&apikey=demo', function( res ) {
            // let input = (res["Weekly Time Series"]);
            //  console.log(input);
            // let boxes = Object.keys(input).map( key => input);
            // // console.log(boxes);

              Object.keys(res["Weekly Time Series"]).forEach((index) => {
                output.push({...res["Weekly Time Series"][index],"date":index});
              });
            });
            // console.log(output)
   setTimeout((ext) => {

    am4core.ready(function() {
        console.log(output)
    // Themes begin
    am4core.useTheme(am4themes_animated);
    // Themes end

    // Create chart
    var chart = am4core.create("chartdiv", am4charts.XYChart);
    chart.padding(0, 15, 0, 15);

    // Load data
    // chart.dataSource.url = "https://www.amcharts.com/wp-content/uploads/assets/stock/MSFT.csv";
    // chart.dataSource.parser = new am4core.CSVParser();
    // chart.dataSource.parser.options.useColumnNames = true;
    // chart.dataSource.parser.options.reverse = true;
    chart.data = output;
    // the following line makes value axes to be arranged vertically.
    chart.leftAxesContainer.layout = "vertical";

    // uncomment this line if you want to change order of axes
    //chart.bottomAxesContainer.reverseOrder = true;

    var dateAxis = chart.xAxes.push(new am4charts.DateAxis());
    dateAxis.renderer.grid.template.location = 0;
    dateAxis.renderer.ticks.template.length = 8;
    dateAxis.renderer.ticks.template.strokeOpacity = 0.1;
    dateAxis.renderer.grid.template.disabled = true;
    dateAxis.renderer.ticks.template.disabled = false;
    dateAxis.renderer.ticks.template.strokeOpacity = 0.2;
    dateAxis.renderer.minLabelPosition = 0.01;
    dateAxis.renderer.maxLabelPosition = 0.99;
    dateAxis.keepSelection = true;
    dateAxis.minHeight = 30;

    dateAxis.groupData = true;
    dateAxis.minZoomCount = 5;

    // these two lines makes the axis to be initially zoomed-in
    // dateAxis.start = 0.7;
    // dateAxis.keepSelection = true;

    var valueAxis = chart.yAxes.push(new am4charts.ValueAxis());
    valueAxis.tooltip.disabled = true;
    valueAxis.zIndex = 1;
    valueAxis.renderer.baseGrid.disabled = true;
    // height of axis
    valueAxis.height = am4core.percent(65);

    valueAxis.renderer.gridContainer.background.fill = am4core.color("#000000");
    valueAxis.renderer.gridContainer.background.fillOpacity = 0.05;
    valueAxis.renderer.inside = true;
    valueAxis.renderer.labels.template.verticalCenter = "bottom";
    valueAxis.renderer.labels.template.padding(2, 2, 2, 2);

    //valueAxis.renderer.maxLabelPosition = 0.95;
    valueAxis.renderer.fontSize = "0.8em"

    // "2021-06-03": {
    //         "1. open": "145.0000",
    //         "2. high": "145.8800",
    //         "3. low": "143.7500",
    //         "4. close": "145.5500",
    //         "5. volume": "9335112"
    //     },


    var series = chart.series.push(new am4charts.CandlestickSeries());
    series.dataFields.dateX = ["date"];
    series.dataFields.openValueY = ["1. open"];
    series.dataFields.valueY = ["4. close"];
    series.dataFields.lowValueY = ["3. low"];
    series.dataFields.highValueY = ["2. high"];
    series.clustered = false;
    series.tooltipText = "open: {openValueY.value}\nlow: {lowValueY.value}\nhigh: {highValueY.value}\nclose: {valueY.value}";
    series.name = "MSFT";
    series.defaultState.transitionDuration = 0;

    var valueAxis2 = chart.yAxes.push(new am4charts.ValueAxis());
    valueAxis2.tooltip.disabled = true;
    // height of axis
    valueAxis2.height = am4core.percent(35);
    valueAxis2.zIndex = 3
    // this makes gap between panels
    valueAxis2.marginTop = 30;
    valueAxis2.renderer.baseGrid.disabled = true;
    valueAxis2.renderer.inside = true;
    valueAxis2.renderer.labels.template.verticalCenter = "bottom";
    valueAxis2.renderer.labels.template.padding(2, 2, 2, 2);
    //valueAxis.renderer.maxLabelPosition = 0.95;
    valueAxis2.renderer.fontSize = "0.8em"

    valueAxis2.renderer.gridContainer.background.fill = am4core.color("#000000");
    valueAxis2.renderer.gridContainer.background.fillOpacity = 0.05;

    var series2 = chart.series.push(new am4charts.ColumnSeries());
    series2.dataFields.dateX = ["date"];
    series2.clustered = false;
    series2.dataFields.valueY = ["5. volume"];
    series2.yAxis = valueAxis2;
    series2.tooltipText = "{valueY.value}";
    series2.name = "Series 2";
    // volume should be summed
    series2.groupFields.valueY = "sum";
    series2.defaultState.transitionDuration = 0;

    chart.cursor = new am4charts.XYCursor();

    var scrollbarX = new am4charts.XYChartScrollbar();

    var sbSeries = chart.series.push(new am4charts.LineSeries());
    sbSeries.dataFields.valueY = "Close";
    sbSeries.dataFields.dateX = "Date";
    scrollbarX.series.push(sbSeries);
    sbSeries.disabled = true;
    scrollbarX.marginBottom = 20;
    chart.scrollbarX = scrollbarX;
    scrollbarX.scrollbarChart.xAxes.getIndex(0).minHeight = undefined;


    /**
     * Set up external controls
     */

    // Date format to be used in input fields
    var inputFieldFormat = "yyyy-MM-dd";

    document.getElementById("b1m").addEventListener("click", function() {
      var max = dateAxis.groupMax["day1"];
      var date = new Date(max);
      am4core.time.add(date, "month", -1);
      zoomToDates(date);
    });

    document.getElementById("b3m").addEventListener("click", function() {
      var max = dateAxis.groupMax["day1"];
      var date = new Date(max);
      am4core.time.add(date, "month", -3);
      zoomToDates(date);
    });

    document.getElementById("b6m").addEventListener("click", function() {
      var max = dateAxis.groupMax["day1"];
      var date = new Date(max);
      am4core.time.add(date, "month", -6);
      zoomToDates(date);
    });

    document.getElementById("b1y").addEventListener("click", function() {
      var max = dateAxis.groupMax["day1"];
      var date = new Date(max);
      am4core.time.add(date, "year", -1);
      zoomToDates(date);
    });

    document.getElementById("bytd").addEventListener("click", function() {
      var max = dateAxis.groupMax["day1"];
      var date = new Date(max);
      am4core.time.round(date, "year", 1);
      zoomToDates(date);
    });

    document.getElementById("bmax").addEventListener("click", function() {
      var min = dateAxis.groupMin["day1"];
      var date = new Date(min);
      zoomToDates(date);
    });

    dateAxis.events.on("selectionextremeschanged", function() {
      updateFields();
    });

    dateAxis.events.on("extremeschanged", updateFields);

    function updateFields() {
      var minZoomed = dateAxis.minZoomed + am4core.time.getDuration(dateAxis.mainBaseInterval.timeUnit, dateAxis.mainBaseInterval.count) * 0.5;
      document.getElementById("fromfield").value = chart.dateFormatter.format(minZoomed, inputFieldFormat);
      document.getElementById("tofield").value = chart.dateFormatter.format(new Date(dateAxis.maxZoomed), inputFieldFormat);
    }

    document.getElementById("fromfield").addEventListener("keyup", updateZoom);
    document.getElementById("tofield").addEventListener("keyup", updateZoom);

    var zoomTimeout;
    function updateZoom() {
      if (zoomTimeout) {
        clearTimeout(zoomTimeout);
      }
      zoomTimeout = setTimeout(function() {
        var start = document.getElementById("fromfield").value;
        var end = document.getElementById("tofield").value;
        if ((start.length < inputFieldFormat.length) || (end.length < inputFieldFormat.length)) {
          return;
        }
        var startDate = chart.dateFormatter.parse(start, inputFieldFormat);
        var endDate = chart.dateFormatter.parse(end, inputFieldFormat);

        if (startDate && endDate) {
          dateAxis.zoomToDates(startDate, endDate);
        }
      }, 500);
    }

    function zoomToDates(date) {
      var min = dateAxis.groupMin["day1"];
      var max = dateAxis.groupMax["day1"];
      dateAxis.keepSelection = true;
      //dateAxis.start = (date.getTime() - min)/(max - min);
      //dateAxis.end = 1;

      dateAxis.zoom({start:(date.getTime() - min)/(max - min), end:1});
    }

    });        // end am4core.ready()

}, 6000);
The reason to setting out time is conversion take time initially for now I used setTimeOut but when it’s done I replace it with promise


