

DataTables is a powerful jQuery plugin for creating table listings and adding interactions to them. It provides searching, sorting and pagination without any configuration. In this article we’ll go through the basics of DataTable and how to use some of the advanced features.
Key Takeaways
- jQuery DataTables is a versatile plugin that enhances HTML tables with capabilities like search, sort, and pagination without needing manual configuration.
- To utilize DataTables, include the library and the latest version of jQuery; the plugin can work with data from HTML tables, JavaScript arrays, or Ajax sources.
- DataTables uses Hungarian notation for variable naming, aiding in understanding the data type each variable holds, such as strings, integers, arrays, or functions.
- Advanced customization options include altering column rendering with “mRender,” managing large datasets with server-side processing, and extending functionality with various DataTables extensions.
- DataTables supports saving the state of the table (like pagination and search) across page refreshes using localStorage or custom callback functions, enhancing user experience in dynamic web applications.
Setting up DataTables
The first step is to obtain the library from the DataTables website. 1.9.4 is the current stable version and 1.10 is in development now. If you don’t want to download the files, you can also make use of the Microsoft CDN. As it is a jQuery plugin you should include the jQuery library too, preferably the latest version.
Naming conventions
Before we move on, it’s useful to understand the conventions used in the library. DataTables uses Hungarian notation for naming variables, which basically adds certain prefix to its name that helps to understand type of data held by the variable.
n – Variable represents a node.
o – Variable represents an object.
a – Variable represents an array.
s – variable is a string.
b – Boolean
f – Float
i – Variable holds an integer value.
fn – Variable represents a function.
Sometimes you will see multiple prefixes used together, like ao, which represents an array of objects.
Getting started
DataTables can work with data from a verity of sources. It can directly work on an HTML table or we can specify data as an array while initialization. Or it can work on data coming from an Ajax source.
In this article we’ll create a listing of websites in the SitePoint network. We’ll start with the listing of a few site names, and then we’ll add more columns and features. Here we have an HTML table with one column that lists the names of just three sites. Let’s see what DataTables can do with a minimal setup.
<html>

<head>

  <link rel="stylesheet" type="text/css" href="http://ajax.aspnetcdn.com/ajax/jquery.dataTables/1.9.4/css/jquery.dataTables.css">

</head>

<body>

  <table id="example">

    <thead>

      <tr><th>Sites</th></tr>

    </thead>

    <tbody>

      <tr><td>SitePoint</td></tr>

      <tr><td>Learnable</td></tr>

      <tr><td>Flippa</td></tr>

    </tbody>

  </table>

  <script type="text/javascript" charset="utf8" src="http://ajax.aspnetcdn.com/ajax/jQuery/jquery-1.8.2.min.js"></script>

  <script type="text/javascript" charset="utf8" src="http://ajax.aspnetcdn.com/ajax/jquery.dataTables/1.9.4/jquery.dataTables.min.js"></script>

  <script>

  $(function(){

    $("#example").dataTable();

  })

  </script>

</body>

</html>
Copy-paste this code to an html page and open it up in a browser. You will see a nice looking table as shown below.
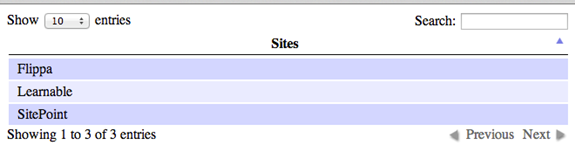
Now you know the power of DataTable and what we can accomplish with it. With this most basic setup, we can search for site names from the top search box and sort them by clicking on the column name. How difficult would be if you were trying to implement those features on your own?
Here we’ve first included the DataTables CSS file in the top and Js in the bottom. $("#example").dataTable() will instantiate the DataTable on the table with the id example.
Now we need to list more sites with more details about each site. Let’s say we have a list in our hand, with details like site name, URL, type and last updated but in a JavaScript array instead of an HTML table. Type can be blog, forum or marketplace and the last updated column will have null value for sites that are not blogs.
Here we want to show N/A instead of null values in the last updated column and make URLs a clickable link.
We’ll first create an HTML table, with the required column headings and an empty table body.
<table id="example">

  <thead>

    <tr><th class="site_name">Name</th><th>Url </th><th>Type</th><th>Last modified</th></tr>

  </thead>

  <tbody>

  </tbody>

</table>
Now let’s apply DataTables to this table.
$("#example").dataTable({

  "aaData":[

    ["Sitepoint","https://www.sitepoint.com","Blog","2013-10-15 10:30:00"],

    ["Flippa","http://flippa.com","Marketplace","null"],

    ["99designs","http://99designs.com","Marketplace","null"],

    ["Learnable","http://learnable.com","Online courses","null"],

    ["Rubysource","http://rubysource.com","Blog","2013-01-10 12:00:00"]

  ],

  "aoColumnDefs":[{

        "sTitle":"Site name"

      , "aTargets": [ "site_name" ]

  },{

        "aTargets": [ 1 ]

      , "bSortable": false

      , "mRender": function ( url, type, full )  {

          return  '<a href="'+url+'">' + url + '</a>';

      }

  },{

        "aTargets":[ 3 ]

      , "sType": "date"

      , "mRender": function(date, type, full) {

          return (full[2] == "Blog")

                    ? new Date(date).toDateString()

                    : "N/A" ;

      }

  }]

});
Now our table will be as shown below. We have a clickable link in the URL column of all records and the last modified column looks pretty neat.
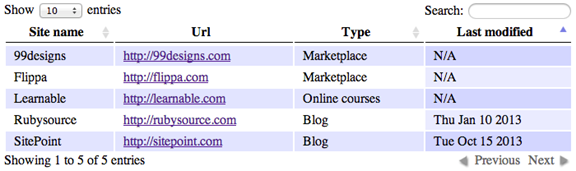
We have given the json array using the aaData option of DataTables. If you look at the code, you’ll see a “aoColumnDefs” option passed to the DataTables, which have an array of some objects. aoColumnDefs property basically decides how each column should be rendered in the table. With this property, you can modify any arbitrary column in the table, specified by the aTargets property of the object.
The value in aTargets array can be the class name specified in the column heading, an index of the column (starting from 0 for left to right or negative index for right to left) or “_all” to match all columns of the table. “sTitle“:”Site name” for the first column will override the column heading of the first column.
Note that the sorting icon is missing in the second column, because sorting based on the URLs doesn’t make much sense. I’ve removed it by setting bSortable:false for the corresponding column. mRender is a powerful option that can be used to alter the data displayed. This attribute can be given in a number of ways ways. When used an integer value, it will use that as the index to the data array. When a string is given, it will use the property of the json object with that name.
These are useful especially when we are displaying json data returned from the server. mRender can also be a function, which will be called when rendering each cell of that column. The function will get three parameters, value, type and the entire row and it should return what we want render in its place. Our function just created a link to that URL and returned it.
Likewise for the last updated column, we are checking the value in the third column of each row. If it is a Blog, function will return the formatted date else it will return “N/A”.
The “sType” attribute helps us to specify the expected type of that column, which decides how the values will be sorted for that column. By default, DataTables supports four types: string, numeric, date and HTML. You can extend it by defining custom types. Here we’ve specified the type as “date” and hence it will be using a date based sorting. Otherwise it will consider the column as just string and sorting may not make any sense.
Server side processing
In the above examples we have worked with a plain HTML table and a json array directly given in the client side. Sometimes the database will have too many records and it may not be wise to fetch them all at once and apply DataTables to it. Instead we can use the server-side processing feature provided by the library and fetch the only records that are currently displayed in the front-end.
Each time the table is rendered, DataTables will send a request with number of parameters to the server, including the starting point, display length, search data, sorting column etc. The server can use them in an SQL query to filter the data and send them back to the client. DataTables expect a few attributes in the returned json data to display them correctly in the front-end. They are:
iTotalRecords – Number of total records in the table, before applying the filters.
iTotalDisplayRecords – Number of records returned after applying the filters.
sEcho – An un-altered copy of the sEcho sent from the client.
aaData – Array of data from the server.
And the json response from server may look something like:
{

    "iTotalRecords": 50,

    "iTotalDisplayRecords": 10,

    "sEcho":10,

    "aaData": [

        {"name": "Sitepoint", "url": "https://www.sitepoint.com", "editor" :{ "name" : "John Doe", "phone" : ["9191919", "1212121"], "email":[]}},

        {"name": "Flippa", "url": "http://flippa.com",  "editor": { "name": "Adam Smith", "email" : ["adam.smith@domain.com"], "phone":[] }}

    ]

}
In order to render this, we’ll first create an html table with the corresponding column headings.
$("#example").dataTable({

  "bServerSide": true,

  "sAjaxSource": "http://localhost/data_source.json",

  "aoColumns": [{

    "mData":"name",

    "sTitle": "Site name"

  },{

    "mData": "url",

    "mRender": function ( url, type, full )  {

      return  '<a href="'+url+'">' + url + '</a>';

    }

  },{

    "mData": "editor.name"

  },{

    "mData": "editor.phone"

  },{

    "mData":"editor",

    "mRender": function(data){

      return data.email.join("<br>");

    }

  }]

});
Here we’ve just told DataTables to load the data from server by setting bServerSide to true. Once it’s enabled, we should also provide a data source, using sAjaxSource property. In the json data returned from the server, by default DataTables will look for the aaData to get the data to be displayed in the table. You can override this by specifying the attribute name in sAjaxDataProp property.
In this case we are getting an array of json objects, so we should map which key should be displayed in which column. We have used aoColumns instead of aoColumnDefs. Both do the same thing, but in a different way. When using aoColumns the length of array should be equal to number of columns in HTML table so that we should provide a mapping for each column.
In the json response editor field is an object with name, email and phone fields. “mData“: “editor.name” tells DataTables to take the name property of the editor object. Note that phone and email are arrays, which will be automatically concatenated using commas, or we can write a custom mRender function to make it look better.
There is more…
Apart from the above-mentioned features, DataTables provides lots of really useful functionalities and we can extend them by using or writing our own plugins. It also provides a simple API to manipulate the table once it’s created.
var oTable =  $('#example'). dataTable();

$('#example').on('click', 'tr', function(){

	var oData = oTable.fnGetData(this);

	console.log(oData);

})
This code will log value data in a row when we click on it. fnGetData basically accepts a TR/TD node or the index of row and return the value in that row or cell.
Sometimes it will be useful to save the current state of a table when we switch from one page to another page. You can enable state saving by setting “bStateSave” : false, during initialization. By default the state will be saved in a cookie. DataTables allows us to define callback function to override this, so that we can store it in Localstorage or in the server itself. Here is an example that’ll save the state in Localstorage.a
$("#example").dataTable({

      bStateSave : true,

      fnStateSave :function(settings,data){

        localStorage.setItem("dataTables_state", JSON.stringify(data));

      },

      fnStateLoad: function(settings) {

        return JSON.parse(localStorage.getItem("dataTables_state"));

      }

    });
Here fnStateSave will be called to save the state as soon as the table is rendered. Next time before rendering the table, it will call fnStateLoad and load the previously stored state. Note: in version 1.10, DataTables will be using localStorage as the default store to save the state.
Summary
DataTables is a highly flexible and feature rich library to work with tables and listing. The library provides a lot of configuration options and a simple API. It is impossible to discuss all the functionalities in a single article. So we have briefly discussed some of the most useful features and how to use them.
Please try out them and let me know if you have any issues. I’ll try my level best to help.
Take your jQuery skills to the next level with SitePoint’s premium subscription service. You’ll find dozens of books and courses on JavaScript and jQuery — and more added every month!
Frequently Asked Questions (FAQs) about jQuery DataTables
How Can I Add a Custom Button to jQuery DataTables?
Adding a custom button to jQuery DataTables involves using the DataTables Button extension. This extension provides a flexible way to add buttons to your DataTables. You can add buttons for various functionalities like copy, CSV, Excel, PDF, and print. To add a custom button, you need to include the DataTables Button library and define the button in the DataTables initialization script. Here’s a simple example:$('#myTable').DataTable( {
dom: 'Bfrtip',
buttons: [
{
text: 'My Custom Button',
action: function ( e, dt, node, config ) {
alert( 'Button activated' );
}
}
]} );
In this example, ‘My Custom Button’ will appear on your DataTable, and when clicked, it will display an alert saying ‘Button activated’.
How Can I Implement Server-Side Processing with jQuery DataTables?
Server-side processing can be beneficial when dealing with large data sets. This method involves handling data processing on the server-side, reducing the load on the client-side. To implement server-side processing, you need to set the ‘serverSide’ option to true and define the ‘ajax’ option in your DataTables initialization script. Here’s an example:$('#myTable').DataTable( {
processing: true,
serverSide: true,
ajax: {
url: 'scripts/server_processing.php',
type: 'POST'
}} );
In this example, ‘scripts/server_processing.php’ is the server-side script that handles data processing. This script should return data in the format expected by DataTables.
How Can I Customize the Style of jQuery DataTables?
jQuery DataTables can be styled using CSS. DataTables has a number of built-in classes that you can use to style your tables. You can also add your own custom classes. To customize the style, you need to include a CSS file in your HTML document and define your styles in this file. Here’s an example:.dataTables_wrapper .dataTables_paginate {
float: right;
text-align: right;
padding-top: 0.25em;}
In this example, the pagination controls of the DataTable are styled to be aligned to the right and have a top padding of 0.25em.
How Can I Add a Search Box to jQuery DataTables?
A search box is automatically included when you initialize a DataTable. However, if you want to customize the search box or place it somewhere else in your document, you can use the ‘dom’ option in your DataTables initialization script. Here’s an example:$('#myTable').DataTable( {
dom: '<"top"f>rt<"bottom"lp><"clear">'} );
In this example, ‘f’ represents the search box. The search box is placed at the top of the DataTable, above the table records (‘rt’) and the length and pagination controls (‘lp’).
How Can I Add Pagination to jQuery DataTables?
Pagination is automatically included when you initialize a DataTable. However, if you want to customize the pagination controls, you can use the ‘pagingType’ option in your DataTables initialization script. Here’s an example:$('#myTable').DataTable( {
pagingType: 'full_numbers'} );
In this example, ‘full_numbers’ means that the pagination controls will include first, previous, next, last, and page number buttons.
How Can I Add Column Filtering to jQuery DataTables?
Column filtering can be added using the DataTables ColumnFilter extension. This extension provides a way to add input boxes or select lists to each column footer for filtering. To add column filtering, you need to include the DataTables ColumnFilter library and call the ‘columnFilter’ function in your DataTables initialization script. Here’s an example:$('#myTable').DataTable().columnFilter();
In this example, input boxes are added to each column footer for filtering.
How Can I Add Row Selection to jQuery DataTables?
Row selection can be added using the DataTables Select extension. This extension provides a way to add row selection functionality to your DataTables. To add row selection, you need to include the DataTables Select library and set the ‘select’ option to true in your DataTables initialization script. Here’s an example:$('#myTable').DataTable( {
select: true} );
In this example, row selection is enabled, and you can select rows by clicking on them.
How Can I Add Column Reordering to jQuery DataTables?
Column reordering can be added using the DataTables ColReorder extension. This extension provides a way to add drag-and-drop column reordering functionality to your DataTables. To add column reordering, you need to include the DataTables ColReorder library and set the ‘colReorder’ option to true in your DataTables initialization script. Here’s an example:$('#myTable').DataTable( {
colReorder: true} );
In this example, column reordering is enabled, and you can reorder columns by dragging and dropping them.
How Can I Add Column Visibility Control to jQuery DataTables?
Column visibility control can be added using the DataTables Buttons extension. This extension provides a way to add a button that controls the visibility of columns in your DataTables. To add column visibility control, you need to include the DataTables Buttons library and define a ‘colvis’ button in your DataTables initialization script. Here’s an example:$('#myTable').DataTable( {
dom: 'Bfrtip',
buttons: [ 'colvis' ]} );
In this example, a ‘colvis’ button is added to your DataTable, and when clicked, it will display a list of columns that you can show or hide.
How Can I Add Exporting Functionality to jQuery DataTables?
Exporting functionality can be added using the DataTables Buttons extension. This extension provides a way to add buttons that export your DataTables data to various formats like copy, CSV, Excel, PDF, and print. To add exporting functionality, you need to include the DataTables Buttons library and define the export buttons in your DataTables initialization script. Here’s an example:$('#myTable').DataTable( {
dom: 'Bfrtip',
buttons: [ 'copy', 'csv', 'excel', 'pdf', 'print' ]} );
In this example, copy, CSV, Excel, PDF, and print buttons are added to your DataTable, and when clicked, they will export your DataTables data to the corresponding format.

