Debugging and Profiling PHP with Xdebug
Key Takeaways
- Xdebug is a powerful, free, and open-source PHP extension that provides debugging support, stack traces, profiling, code coverage, and more. It allows developers to pause the application’s execution at any point to inspect variables’ values, thus providing better insight into what PHP is doing.
- Xdebug can be used as a profiling tool for PHP applications, recording important details like the time it takes for statements and functions to execute, the number of times they are called, etc. This output can be analyzed to understand where the bottlenecks are, helping to optimize the application for better performance.
- To use Xdebug, it needs to be installed and configured correctly. It is preinstalled in XAMPP or MAMP and just needs to be enabled in the php.ini. For other platforms, it can be installed through the package manager. It should be noted that using other Zend extensions may cause conflicts with Xdebug.
PHP is the most popular language for web development, but a common criticism against it used to be that it lacked a suitable debugger. Developers using languages like Java and C# enjoy a powerful suite of debugging tools, often integrated directly with their IDEs. But the disconnected nature of web servers and PHP IDEs prevented us from having many of the same tools available. We manually added debug statements in our code… until Xdebug filled the void.
Xdebug is a free and open source project by Derick Rethans and is probably one of the most useful PHP extensions. It provides more than just basic debugging support, but also stack traces, profiling, code coverage, and so on. In this article you’ll see how to install and configure Xdebug, how to debug your PHP application from Netbeans, and how to read a profiling report in KCachegrind.
Installing and Configure Xdebug
If you are using XAMPP or MAMP, Xdebug comes preinstalled; you just need to enable it in your php.ini. If you are using a package based installation on a platform such as Ubuntu, you can install it through your package manager with a command like apt-get install php5-xdebug.
The entries for Xdebug in my php.ini look like this:
[xdebug]
zend_extension="/Applications/MAMP/bin/php5.2/lib/php/extensions/no-debug-non-zts-20060613/xdebug.so"
xdebug.remote_enable=1
xdebug.remote_host=localhost
xdebug.remote_port=9000
zend_extension specifies the path to the Xdebug module. The xdebug.remote_enable value toggles whether the extension is active or not. xdebug.remote_host is the name or the IP address of your system (here I’ve specified localhost because I’m working all on the same machine, but the value can be an IP Address or a DNS hostname if you need to specify something different for your setup). xdebug.remote_port is the port on which the client listens for a connection from Xdebug (9000 is the default value).
When you use Xdebug, it’s important to make sure you are not using any other Zend extensions since they may conflict with Xdebug.
There are other installation options as well. The Xdebug website provides a simple wizard to guide you through installation. You can take the output of phpinfo() or php –i and paste it in the text box and have the wizard analyze your server’s configuration and instruct you on how to compile Xdebug for your machine.
Debugging
More often than not it’s tempting to use the var_dump() and exit/die() combination for debugging. But the problem with this approach is that you have to modify the code for debugging; you must remember every place you added output statements and remove them after debugging is finished. Xdebug overcomes this by letting you pause your application’s execution where ever you want. Then you can inspect the variables’ values in that scope to get better insight into what PHP is doing.
You can easily configure Netbeans to act as an Xdebug client. Open the options window (Tools > Options) and go to the debugging tab for the PHP section. Enter the debugging port given in php.ini and a Session ID which you’ll need to pass with the requests you want to debug. Now you’ll be able to run the debugger by clicking Debug in the tools tab.
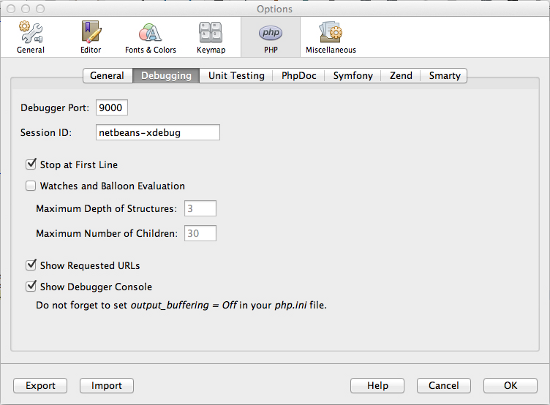
With your source file open, press the Debug button in the toolbar to start debugging. It will open up the application in a browser, and PHP’s execution will pause at the first line of the file if you have enabled the “Stop at first line” option in the Options window. Otherwise, it will run until it encounters the first breakpoint. From there you can continue to the next break point using the continue button.
Notice in the brower’s URL bar the XDEBUG_SESSION_START parameter. To trigger the debugger you must pass XDEBUG_SESSION_START as a request parameter (GET/POST) or XDEBUG_SESSION as a cookie parameter.
There are some other useful actions in the debugging toolbar. They are:
- Step over – Step over the currently executing line
- Step into – Step into the function (for non-built-in functions)
- Step out – Step out of the current function
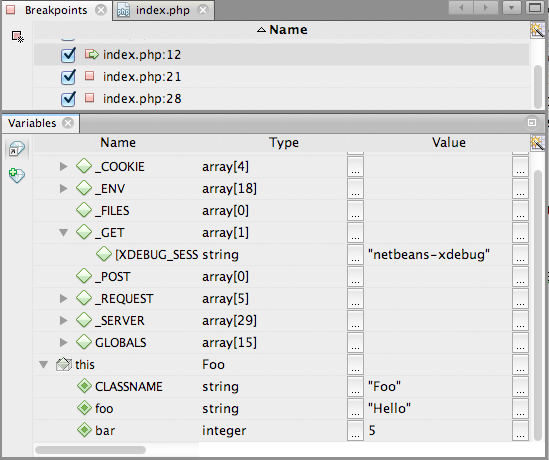
You can add breakpoints by clicking the line number in the editor’s margin and then pause execution on them. They can be removed by clicking on them again. Alternatively, go to Window > Debugging > Breakpoints which will list all breakpoints in your program and you can select/deselect only those you needed.
While running, the state of the variables in the current scope are shown in the variables window. It will show the values of local variables and super global variables like $_COOKIE, $_GET, $_POST and $_SERVER. You can watch their values change as you step through through the statements.
Profiling
Profiling is the first step when optimizing any application. Profiling tools record important details like the time it takes for statements and functions to execute, the number of times they are called, and so on. The output can be analyzed to understand where the bottlenecks are.
Xdebug can also be used as a profiling tool for PHP. To start profiling your applications, add the following settings to php.ini:
xdebug.profiler_enable = 1
xdebug.profiler_output_name = xdebug.out.%t
xdebug.profiler_output_dir = /tmp
xdebug.profiler_enable_trigger = 1
Profiling is disabled by default in Xdebug, so xdebug.profiler_enable is used to enable it. xdebug.profiler_output_name is the filename of the profiler log (the %t specifier appends a timestamp to the filename; see the documentation for a full list of specifiers). Xdebug stores the profiling output in the directory specified by xdebug.profiler_output_dir. You can can change this to a location of your choice, but remember it must have write permissions for the user account under which the PHP script is run.
Profiling degrades performance since the PHP engine need to look af each function call and log its details, so you don’t want to run it all the time. xdebug.profiler_enable_trigger instructs Xdebug to perform profiling only when XDEBUG_PROFILE is passed as a GET or POST parameter.
The log file created by Xdebug can be small or large depending on what the application is doing. Also, it’s not really reader friendly. You’ll want to use programs like KCachegrind or Webgrind to view them. KCachegrind is a profile data visualization tool for KDE, which needs a Unix environment to run, whereas Webgrind is a web-based tool.
Opening the profiling long file in KCachegrind will show the cost of each function call starting at main(). Here is the KCachegrind visualization of profiling output of a function to find a factorial:
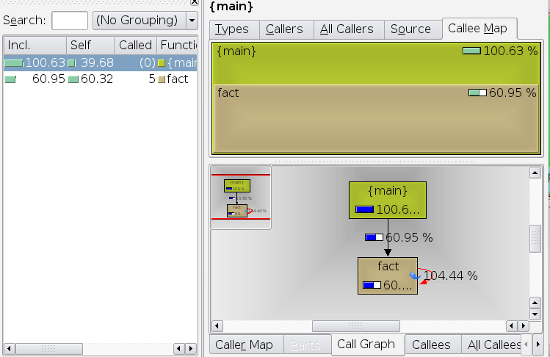
The left side panel (Function Profile) shows the time taken by each function in their execution order. The top right panel graphically displays the same information with the size corresponding to the cost of the function. The call graph represents the relationship between functions in the application. In this example there are only two functions, main() and fact(). fact() is a recursive function, which is indicated using a cycle in the graph.
While optimizing your code, you should look for the areas with highest total cost. More often than not, I/O operations will have the highest cost. Remember to reduce them as much as possible. Lazy load files wherever that makes sense.
Suppose you have a class named Orders which will give you a list of all orders and their details from your web store.
<?php
class Orders
{
    protected $db;
    public function __construct(PDO $db) {
        $this->db = $db;
    }
    public function getAll() {
        $orders = array();
        $query = "SELECT * FROM orders";
        $result = $this->db->query($query);
        while ($row = $result->fetch(PDO::FETCH_ASSOC)) {
            $row['details'] =
                $this->getDetails($row['orderId']);
            $orders[] = $row;
        }
        return $orders;
    }
    public function getDetails($orderId){
        $details = array();
        $result = $this->db->query("SELECT * FROM orderdetails WHERE orderId = " . $orderId);
        while ($row = $result->fetch(PDO::FETCH_ASSOC)) {
            $details[] = $row;
        }
        return $details;
    }
}
This class has two methods: getAll() and getDetails(). When you call the getAll() method, it will get all of the records from the orders table and loop through them to get the details of all records.
Let’s have a look at the profiling information.
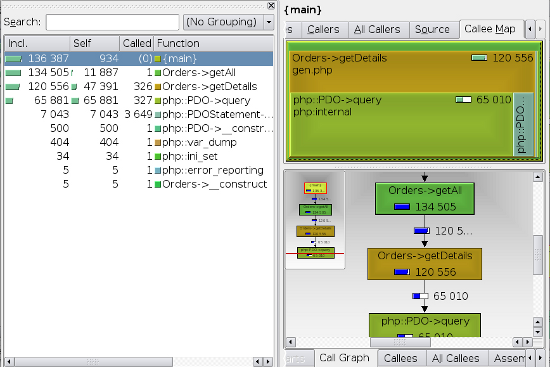
Though the absolute figures are not significant since they depend on the platform and runtime conditions, you will get an idea about relative cost of different functions. Notice that some functions are called hundreds of times (which is bad of course). The code doesn’t need to loop through all of the orders and get the details of each order individually. Let’s rewrite the getAll() function to use a JOIN instead.
<?php
pubilc function getAll() {
    $orders = array();
    $query = "SELECT * FROM orders o
        JOIN orderdetails d ON o.orderId = od.Id
        ORDER BY o.orderId
        ";
    $result = $this->db->query($query);
    while($row =$result->fetch(PDO::FETCH_ASSOC)){
        $orders[] = $row;
    }
    return $orders;
}
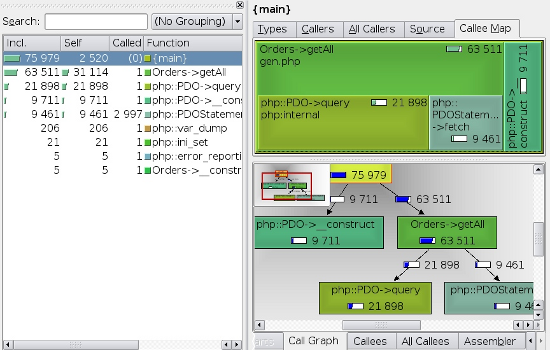
Now the profiling yields a better result since the number of queries has decreased. Also, the code isn’t calling the getDetails() function any more.
Summary
Xdebug act as a middleman that controls the execution of PHP programs in the server. In this article you’ve seen two of the most impressive features of Xdebug – debugging support and profiling support.
Its remote debugging allows you to inspect values at runtime, without modifying your program, to get a better understanding of what PHP is doing. Profiling helps uncover bottlenecks in your code so you can optimize it for better performance.
I hope this article helps you realize the benefits of Xdebug and encourages you to start using it right away if you aren’t already. And if you find this a valuable tool, you might even want to consider supporting this great project by buying a support agreement.
Image via Fotolia
Frequently Asked Questions about Debugging and Profiling PHP with Xdebug
How do I install Xdebug for PHP debugging and profiling?
Xdebug is a powerful tool for debugging and profiling PHP applications. To install Xdebug, you need to have PHP installed on your system. You can download Xdebug from the official website and follow the installation instructions provided. The process involves adding Xdebug to your php.ini file and restarting your web server. Remember to check your PHP version before downloading the appropriate Xdebug version.
How do I use Xdebug for step-by-step debugging?
Xdebug allows you to debug your PHP code step-by-step. To do this, you need to configure your IDE to connect with Xdebug. Once connected, you can set breakpoints in your code where execution will pause, allowing you to inspect the current state of your application. This is particularly useful for identifying and fixing bugs in your code.
What is profiling in Xdebug and how can I use it?
Profiling is a process that measures the performance of your PHP code. Xdebug provides a profiler that gives you detailed reports on how long each part of your code takes to execute. To use the profiler, you need to enable it in your Xdebug configuration and specify a directory where the profiler output should be written. You can then use tools like KCacheGrind or QCacheGrind to analyze the profiler output.
How can I configure Xdebug with PhpStorm?
PhpStorm is a popular IDE that supports Xdebug for debugging and profiling PHP applications. To configure Xdebug with PhpStorm, you need to set up a server in PhpStorm settings and configure the Xdebug settings in your php.ini file. Once configured, you can use PhpStorm’s built-in debugger to debug your PHP code with Xdebug.
How can I use Xdebug to profile my PHP applications?
Xdebug’s profiler allows you to measure the performance of your PHP applications. To use it, you need to enable the profiler in your Xdebug configuration and specify a directory for the profiler output. You can then use a tool like KCacheGrind or QCacheGrind to analyze the profiler output and identify any performance bottlenecks in your code.
How can I view Xdebug output?
Xdebug outputs its debugging and profiling information in a format that can be read by various tools. For debugging, you can view the output directly in your IDE if it supports Xdebug. For profiling, you can use tools like KCacheGrind or QCacheGrind to view and analyze the profiler output.
How can I debug remote PHP applications with Xdebug?
Xdebug supports remote debugging, allowing you to debug PHP applications running on a different machine. To do this, you need to configure Xdebug and your IDE to communicate over a network. This involves setting up a DBGp proxy and configuring your IDE to connect to it.
How can I improve the performance of my PHP application with Xdebug?
Xdebug’s profiler can help you identify performance bottlenecks in your PHP code. By analyzing the profiler output, you can see which parts of your code are taking the longest to execute and focus your optimization efforts there. This can lead to significant improvements in the performance of your PHP application.
Can I use Xdebug with other PHP extensions?
Yes, Xdebug can be used alongside other PHP extensions. However, it’s important to note that Xdebug modifies the behavior of PHP, so it may not be compatible with all extensions. If you encounter issues, you may need to disable other extensions or configure them to work with Xdebug.
How can I troubleshoot issues with Xdebug?
If you’re having trouble with Xdebug, there are several steps you can take to troubleshoot. First, check your Xdebug and PHP configuration to make sure they’re set up correctly. If you’re using an IDE, make sure it’s configured to work with Xdebug. If you’re still having trouble, you can consult the Xdebug documentation or seek help from the Xdebug community.
Shameer is a passionate programmer and open-source enthusiast from Kerala, India. He has experience in web development using Scala, PHP, Ruby, MySQL, and JavaScript. While not working, Shameer spends his time coding personal projects, learning, watching screen casts, blogging, etc. His specific areas of interest include cloud computing, and system and database administration.
Published in
·Computer science·Development Environment·PHP·Programming·Software Development·May 9, 2014


