Object-oriented programming is well and truly in fashion, and PHP is no exception. So you’ve adopted the proper design patterns, built your site on the latest PHP framework, and have your database access abstracted so far that you’ve forgotten SQL.
What’s Going On?
When you first move towards object-oriented programming, the first thing you might notice is that you can give yourself a headache trying to follow the execution path through your code and the framework it’s built on.
The next thing you might notice is that your site isn’t any faster – in fact perhaps it’s slower than it was. Object-oriented programming generally aims to improve the quality, maintainability and reusability of code, but sometimes this comes at the price of some raw speed.
So we’ve got potentially slower code, and we can no longer just open up our simple PHP script and follow its execution from the top of the file to the bottom. How do we figure out exactly what’s going on inside?
Xdebug
Xdebug 2 (currently beta – I’m running 2.0.0RC3) is an indispensable PHP extension which provides various ways of debugging and analysing your code on your development server. Today, we’re interested in profiling information for PHP scripts.
Installing Xdebug on your apache/PHP development server is beyond the scope of this post, but a quick ‘sudo pecl install xdebug-beta’ and a one line edit to my php.ini got it up and running on my Ubuntu 6.10 virtual machine.
Once you have Xdebug 2 installed, the following lines in your .htaccess will turn on auto profiling for all requests handled by PHP:
php_value xdebug.profiler_output_dir /tmp
php_value xdebug.profiler_output_name timestamp
php_value xdebug.profiler_enable 1
Now to open the output files that are appearing in the /tmp directory…
WinCacheGrind
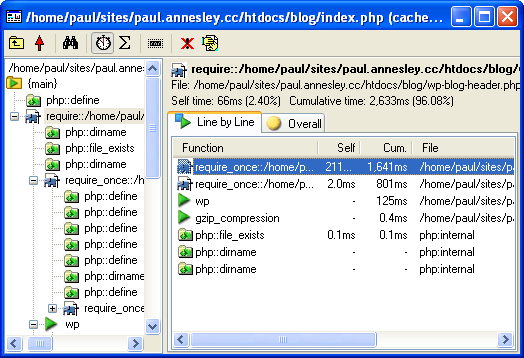
WinCacheGrind is the simplest way to get useful information out of your cachegrind output file. It provides a simple tree view of the PHP execution with references to class, function and filenames. Most importantly, it tells you how long each function call took.

KCachegrind
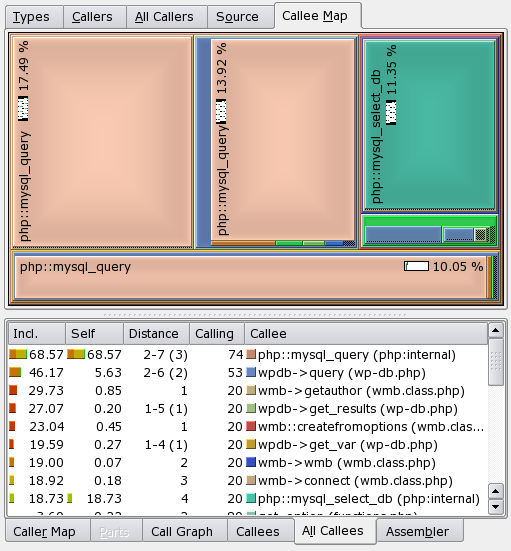
If you’re running KDE (on Linux, or Mac OS X via fink if you’re daring), you might like to give KCachegrind a try. It is much more complicated than WinCacheGrind, but presents your cachegrind data in some very interesting ways.
In this example the callmap view clearly shows that SQL queries through mysql_query() are responsible for most of the execution time.

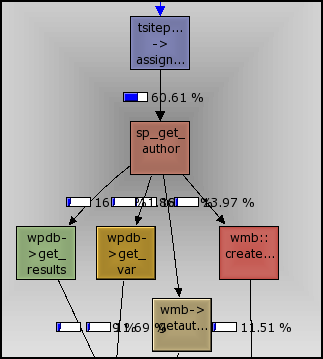
Here we see part of a callgraph, showing function interaction.

Less Grinding, More Caching
And the easiest way to get your code running faster? Cache, cache and more cache.
Use your new tools to find the slow points in your scripts. Make sure slow queries take advantage of your MySQL query cache. Try out a PHP bytecode cache like APC. Cache your PHP objects with memcached. Cache common sections of your generated HTML. Cache entire pages before sending them. Make your users cache your pages with Expires, ETag and Last-Modified HTTP headers. The more layers of caching the better.
More Xdebug
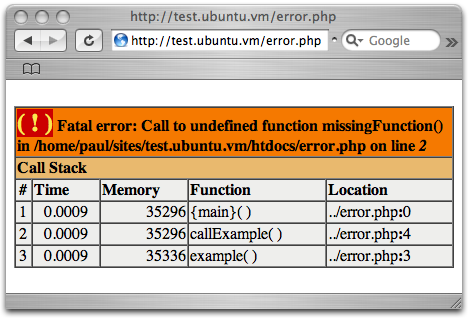
Xdebug does much more than output profiling data – I see it as the Firebug for backend developers. I recommend anybody working with PHP set it up on their development server, even if only for the colourful PHP error reporting with full stack traces:

And by the looks of this Google Summer of Code Project, live interactive debugging with Xdebug will soon be available to all.
Paul is a Rails and PHP developer in the SitePoint group of companies.


