Speed Up Your Site! 8 ASP.NET Performance Tips

Now that you’ve added the finishing touches to your web site and unleashed it onto the world, fame, fortune, and success will surely follow — won’t it?
Unfortunately, your web application’s success can lead to something less desirable — performance and scaling problems. On a traditional desktop application, one thousand users translate to one thousand client computers chugging away, sharing the load of running your application. The application is effectively spread among all the users’ machines. When it comes to a web application, though, those same thousand users are usually serviced by a single machine — your web server.
Success can come at a cost for web applications: a cost in bandwidth and server hardware. However, there are a few clever ways you can reduce — and sometimes eliminate — these problems. We’ll take a look at some of the different approaches to improving the performance of an ASP.NET site in this chapter, which has been extracted from The ASP.NET 2.0 Anthology, 101 Essential Tips, Tricks & Hacks. Feel free to download this chapter — along with three others — for offline reference.
How do I determine what to optimize?
You want your web application to be the best, right? Like all of us, by “best” you mean “fastest.” And what better way to create a blazingly fast application than to optimize everything? Optimize, optimize, optimize — right? Wrong.
Premature optimization refers to the fixing of a performance problem before you understand the problem, or before there even is a problem, and it’s a bad idea.
That’s not to say that you should write sloppy, inefficient code. My point is that you should trust the ASP.NET Framework, and make use of the features that make it such a terrific environment in which to develop, until you hit a problem. Once you hit a problem, you should take the time to understand what that problem is, and only then should you start to look at how best to address it. Dr. Joseph M. Newcomer’s essay, “Optimization: Your Worst Enemy,” gives a fascinating overview of the perils of optimizing in the dark.
The tips in this chapter propose fairly lightweight solutions for some common performance issues. I’ve steered away from dramatic changes, because I don’t want you to end up doubling your development or maintenance time in order to shave a meagre 2% off your page load time. While it is possible to bypass the in-built ASP.NET Page mechanism completely (by using Response.Write, or building an ASHX-based sites), I’m not a fan of these approaches. The ASP.NET system as a whole has been tuned and improved for more than half a decade, and it’s reasonably fast straight out of the box. There’s a good chance that trying to improve on it will result in a slower and less maintainable web site.
So, with all that out of the way, let’s assume that some of your pages are running slowly. How do you figure out what to fix?
Solution
Isolate the bottleneck in your site by measuring the actual speed of the site. This exercise can be performed using logs, database profiling, and tracing.
We’ve discussed the task of logging using log4net in Chapter 13, Handling Errors. If you suspect that the database is the cause of the slowdown (for example, you know that your application makes use of some large queries), you can either step through the page in debug mode to see whether the database calls are taking a long time to return, or you can use the SQL Server Profiler discussed in the section called “How do I speed up my database queries?” later in this chapter. For a very basic analysis of what’s going on in your pages, you can use the ASP.NET trace; while it’s not nearly as good as a full-featured logging system, it’s easy to implement and will provide you with plenty of timing information.
The first step in using the trace is to get into the habit of adding trace statements. Write to the trace whenever you think there’s something you might want to see when you debug future problems. Tracing doesn’t have any real performance impact on your site until it’s enabled in the Web.config, and when you need to troubleshoot a problem, you’ll be glad it’s there.
There’s more information on tracing in Chapter 13, Handling Errors, but the general idea is that you can write to the Trace object like this:
Trace.Write("Here's a trace message.");Tracing is disabled by default; when you want your Trace.Write statements to actually do something, you’ll need to turn tracing on in the Web.config file, as follows:
Example 15.1. Web.config (excerpt)


<?xml version="1.0"?>

<configuration>

  <system.web>

    <trace enabled="true"

        mostRecent="true"

        localOnly="true"/>

  </system.web>

</configuration>
In this solution, we’ll look at a sample page that performs a few different actions — it makes a call to a web service, retrieves some data from a database, and throws an exception. Each function that we’ll use writes a trace message when it begins and ends, via a straightforward utility method called writeTrace. However, it has one slightly complex aspect — it uses the System.Diagnostics object to figure out the method name, so we don’t have to pass it in. The code for our sample page is as follows:
Example 15.2. Trace.aspx.cs (excerpt)


using System;

using System.Web;

public partial class _Default : System.Web.UI.Page

{

  protected void Page_Load(object sender, EventArgs e)

  {

    hitAWebservice();

    getSomeData();

    doSomeProcessing();

    breakSomething();

    displayTheResults();

  }

  private void getSomeData()

  {

    writeTrace(true);

    simulateWaiting(8000);

    writeTrace(false);

  }

  private void hitAWebservice()

  {

    writeTrace(true);

    Trace.Write("A message to demonstrate tracing.");

    simulateWaiting(2000);

    writeTrace(false);

  }

  private void doSomeProcessing()

  {

    writeTrace(true);

    simulateWaiting(1000);

    writeTrace(false);

  }

  private void displayTheResults()

  {

    writeTrace(true);

    simulateWaiting(500);

    writeTrace(false);

  }

  private void breakSomething()

  {

    writeTrace(true);

    try

    {

      int superBig = int.MaxValue;

      superBig += 1;

    }

    catch (Exception ex)

    {

      Trace.Warn("Exception", "Oops", ex);

    }

  }

  private void writeTrace(bool enteringFunction)

  {

    if (!Trace.IsEnabled)

    return;

    string callingFunctionName = "Undetermined method";

    string action = enteringFunction ? "Entering" : "Exiting";

    try

    {

      //Determine the name of the calling function.

      System.Diagnostics.StackTrace stackTrace =

      new System.Diagnostics.StackTrace();

      callingFunctionName =

      stackTrace.GetFrame(1).GetMethod().Name;

    }

    catch { }

    Trace.Write(action, callingFunctionName);

  }

  /// <summary>

  /// Wait a bit.

  /// </summary>

  /// <param name="waitTime">Time in milliseconds to wait.</param>

  private void simulateWaiting(int waitTime)

  {

    System.Threading.Thread.Sleep(waitTime);

  }

}
Right, we’ve got our trace statements in place. Now, let’s assume that this page is taking abnormally long to load, and we’d like to get to the bottom of the problem. With tracing enabled, we can simply load the page, then browse to Trace.axd within our web site; it’s at http://localhost:1209/MySite/Trace.axd.
Figure 15.1 shows the first part of the Trace.axd output that was returned from the previous code.
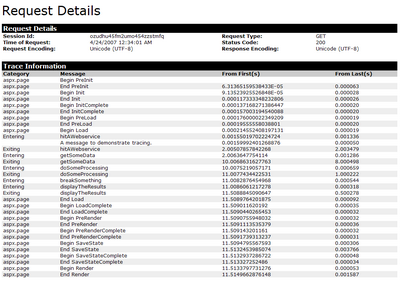
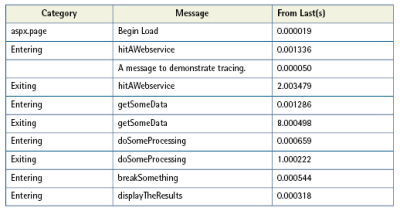
Table 15.1 shows the relevant portion of the trace output.
Right away, we can see which aspect of our page load is taking the majority of time — getSomeData takes eight seconds to execute. Without this information, we might have assumed the web service call was at fault and spent valuable time solving the wrong problem. This example shows how, armed with some real information, we can begin to fix the right problem.
How can I decrease the size of the view state?
One convenience of ASP.NET controls is that they can preserve state across postbacks — a topic we’ve covered in depth in Chapter 6, Maintaining State. This, of course, is a feature that comes at a price — to implement it, we add a hidden field to the page to store the control settings for transmission between the client and server, but depending on the controls the page uses, the view state can sometimes become quite large.
One obvious way to reduce the size of view state is to turn it off if you don’t need it. This adjustment can be performed either at the page level, or at the control level. If, for whatever reason, you can’t disable the view state (for example, your page uses controls that are dependent upon the view state), there are a few other steps you can take to at least reduce its impact on your page size.
Solutions
You have two options for reducing the impact that view state has on your page size — either compress the view state, or store it on the server.
Compressing the View State
The following simple CompressedViewStatePage class implements basic GZIP compression on the page’s view state. It reduced the size of the ViewState object on my sample page from 20,442 bytes to 6,056 bytes — an impressive 70% reduction in size! Here’s the class in all its glory:
Example 15.3. CompressedViewStatePage.cs (excerpt)


using System;

using System.IO.Compression;

using System.IO;

using System.Web.UI;

public class CompressedViewStatePage : System.Web.UI.Page

{

  static public byte[] Compress(byte[] b)

  {

    MemoryStream ms = new MemoryStream();

    GZipStream zs = new GZipStream(ms, CompressionMode.Compress);

    zs.Write(b, 0, b.Length);

    return ms.ToArray();

  }

  static public byte[] Decompress(byte[] b)

  {

    MemoryStream ms = new MemoryStream(b.Length);

    ms.Write(b, 0, b.Length);

    // last 4 bytes of GZipStream = length of decompressed data

    ms.Seek(-4, SeekOrigin.Current);

    byte[] lb = new byte[4];

    ms.Read(lb, 0, 4);

    int len = BitConverter.ToInt32(lb, 0);

    ms.Seek(0, SeekOrigin.Begin);

    byte[] ob = new byte[len];

    GZipStream zs = new GZipStream(ms, CompressionMode.Decompress);

    zs.Read(ob, 0, len);

    return ob;

  }

  protected override object LoadPageStateFromPersistenceMedium()

  {

    byte[] b = Convert.FromBase64String(Request.Form["__VSTATE"]);

    LosFormatter lf = new LosFormatter();

    return lf.Deserialize(Convert.ToBase64String(Decompress(b)));

  }

  protected override void SavePageStateToPersistenceMedium(

      object state

  )

  {

    LosFormatter lf = new LosFormatter();

    StringWriter sw = new StringWriter();

    lf.Serialize(sw, state);

    byte[] b = Convert.FromBase64String(sw.ToString());

    ClientScript.RegisterHiddenField("__VSTATE",

    Convert.ToBase64String(Compress(b)));

  }

}
To use GZIP compression, simply inherit a specific page from the class, like this:
public partial class MyPage : CompressedViewStatePageIf you’re worried about the performance implications of compressing your view state, don’t be. It’s far more likely that bandwidth is a greater bottleneck than CPU time on any given web server. Although there are exceptions to this rule, the GZIP algorithm is blazingly fast on the CPUs of today. Besides, if your server’s CPU operates at 100% all the time, you have far graver problems to worry about than the size of a handful of pages.
This compression algorithm could also be implemented as an HTTP module, which could then be applied to an entire site with a simple Web.config modification. I suggest you try implementing this module as an exercise, if you’re keen. The MSDN article on building an HTTP module is a good place to start.
Storing View State on the Server
The second option for reducing view state’s impact on page size is to prevent view state data from being sent to the client altogether, and instead store the data on the server.
The following ServerViewStatePage class allows us to use the Session object to store the view state:
Example 15.4. ServerViewStatePage.cs (excerpt)


using System;

using System.Web.UI;

using System.Configuration;

using System.IO;

public class ServerViewStatePage : System.Web.UI.Page

{

  private const string _configKey = "ServerViewStateMode";

  private const string _formField = "__SERVERVIEWSTATEKEY";

  private string ViewStateData

  {

    get { return Request.Form[_formField]; }

    set { ClientScript.RegisterHiddenField(_formField, value); }

  }

  private string PersistenceType

  {

    get { return (ConfigurationManager.AppSettings[_configKey]

    ?? "").ToLower(); }

  }


  private object ToObject(string viewstate)

  {

    byte[] b = Convert.FromBase64String(viewstate);

    LosFormatter lf = new LosFormatter();

    return lf.Deserialize(Convert.ToBase64String(b));

  }

  private string ToBase64String(object state)

  {

    LosFormatter lf = new LosFormatter();

    StringWriter sw = new StringWriter();

    lf.Serialize(sw, state);

    byte[] b = Convert.FromBase64String(sw.ToString());

    return Convert.ToBase64String(b);

  }

  private string ToSession(string value)

  {

    string key = Guid.NewGuid().ToString();

    Session.Add(key, value);

    return key;

  }

  private string FromSession(string key)

  {

    string value = Convert.ToString(Session[key]);

    Session.Remove(key);

    return value;

  }

  protected override object LoadPageStateFromPersistenceMedium()

  {

    switch (PersistenceType)

    {

    case "session":

      return ToObject(FromSession(ViewStateData));

    default:

      return base.LoadPageStateFromPersistenceMedium();

    }

  }

  protected override void SavePageStateToPersistenceMedium(

      object ViewStateObject

  )

  {

    switch (PersistenceType)

    {

      case "session":

        ViewStateData = ToSession(ToBase64String(ViewStateObject));

        break;

      default:

        base.SavePageStateToPersistenceMedium(ViewStateObject);

        break;

    }

  }

}
To use ServerViewStatePage, simply inherit a specific page from this class, like this:
public partial class MyPage : ServerViewStatePageThis class is configured via a single setting in Web.config: ServerViewStateMode. Once you’ve configured this setting, you’ll notice that the ViewState object disappears from the page — in its place is a simple ID that’s used to look up the contents of the page’s view state on the server, in the Session object. If you feel uncomfortable storing view state in Session, this class could easily be extended to store view state wherever you like — in the file system, in the ASP.NET cache, or in a database.
As usual, there’s no free lunch here. The decision to push view state to the server and store it in Session has its own drawbacks. For example, the Session object could be lost if the IIS worker process recycles (a loss that does occur every so often in IIS, unless you’ve disabled this default behavior). Furthermore, any change to the underlying application files (such as editing Web.config, or adding new binaries to the bin folder of your application) will also cause the web application to recycle and Session data to be lost. And if you use more than one web server (such as in a web farm environment) you’ll need to manage any shared session state that’s stored in a database.
How can I decrease the bandwidth that my site uses?
ASP.NET abstracts a lot of traditional web development details from the developer. Just drag and drop a few controls on a form, set some properties, write a little bit of code, and — bam! — you’ve got a functioning web site.
However, that doesn’t mean the resulting HTML markup will necessarily be efficient or small. It’s not unusual to see ASP.NET pages that contain more than 100 kilobytes of markup. I recommend that you keep a close eye on the HTML markup that results from your ASP.NET web pages — to keep these file sizes in check can sometimes require additional effort, which is one reason we covered the topic of web standards in Chapter 9, ASP.NET and Web Standards.
Solutions
The first rule of ASP.NET bandwidth control is to know how large your pages are. In Internet Explorer, the File > Properties dialog will tell you how many kilobytes of HTML markup the current page has produced, as Figure 15.2 shows. Firefox has a similar dialog, pictured in Figure 15.3, which can be accessed by selecting Tools > Page Info.
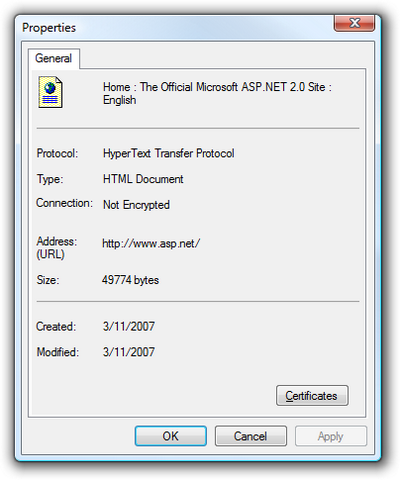
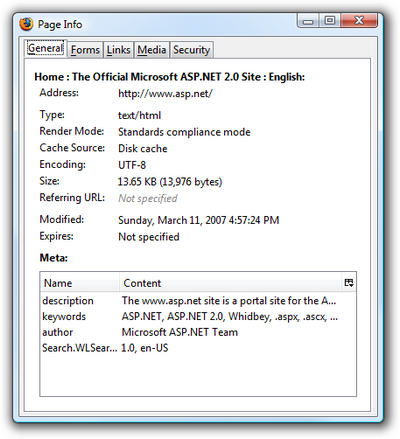
However, note that the Size field in Firefox reports a much smaller number than does IE 7 — 13,976 bytes versus 49,774 bytes. That’s because Firefox shows the actual number of bytes that came down over the wire, whereas IE 7 shows the size of the page after it has been received by the browser.
How is such a discrepancy possible? Well, the ASP.NET web site uses HTTP compression to decrease the page size before sending the page. HTTP compression is a W3C standard that allows the server to provide a GZIP-compressed version of the HTML content to the client, at the cost of a very minor increase in CPU time. The client receives the compressed content, then decompresses it on the fly before rendering the page. Right off the bat, you can see that this is just one easy way to reduce the amount of bandwidth you use by an impressive 72% — simply flip the switch to enable HTTP compression for your web site.
You can enable HTTP compression in two ways. The first takes place at the web server level; the second is implemented via a custom HTTP module at the ASP.NET application level.
Enabling HTTP Compression Support in IIS 6
Use the IIS Service Manager to enable HTTP Compression in IIS 6. Right-click the node for your web site and select Properties. The Service tab contains the settings relevant to compression, as Figure 15.4 shows.
Manual Configuration is Only Necessary in IIS 6
That’s right: it’s only necessary to configure IIS to enable HTTP compression in IIS 6 and earlier, as IIS 7 enables static compression by default. Windows Server 2008 (which had yet to be released at the time of this writing) may offer a user interface to configure dynamic HTTP compression, but Vista’s IIS Manager doesn’t.
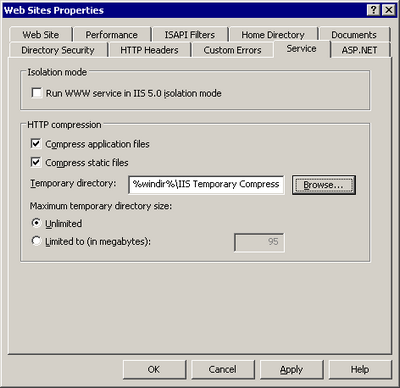
The compression setting available in the GUI works; however, it only affects static content, such as HTML pages and CSS files. This setting won’t do anything to compress dynamic content in ASPX pages. We must resort to editing the metabase — the IIS database for configuration and metadata storage — to deploy dynamic content compression:
- Open the metabase in Notepad. For IIS 6, this is located at
C:WINDOWSsystem32inetsrvMetaBase.xml. For IIS 5, the file is a binary file, so you’ll need to download the Meta-data Edit tool instead. - Search for the
<IIsCompressionScheme>tag. There should be two<IIsCompressionScheme>entries: one for deflate and one for GZIP — the two methods of compression that IIS supports. By default, IIS uses GZIP; deflate is rarely used. - Search for the
HcScriptFileExtensionssection. Add to the list aspx, asmx, php, cgi, and any other file extensions that you want dynamically compressed. Follow the existing format carefully — it’s return-delimited, and any extra spaces will prevent the file extensions from working. Make the same changes in both deflate and GZIP. - Set
HcDynamicCompressionLevelto level 9 (it has a default value of 0, which means “no compression”). I recommend level 9, based on several reports that I’ve read on the Web suggesting that level 10 requires much more CPU time, while offering only a minimal reduction in file size over level 9. Make this change for both deflate and GZIP.
Note that this is a global compression rule that will affect all web sites. This setting is usually what you’ll want, since HTTP compression is so effective and the cost is nominal. However, some poorly coded ASP.NET web sites may be incompatible with compression. In those circumstances, you may want to enable or disable compression on a per-site or per-folder basis — a setting that’s also supported by IIS. The easiest way to configure this setting is to use the command line adsutil.vbs utility:
C:InetpubAdminScripts>adsutil.vbs set w3svc/ (site#) /root/DoStat

➥icCompression False

C:InetpubAdminScripts>adsutil.vbs set w3svc/ (site#) /root/DoDyna

➥micCompression False
The (site#) number can be obtained from the log properties dialog in the IIS server properties, and usually takes the form W3SVCn, where n is an arbitrary site number.
Enabling HTTP Compression Support in an ASP.NET Application
Perhaps you don’t have control over the IIS settings on your server. Or maybe you’d just like a way to enable compression for your specific ASP.NET application. That’s possible too.
The open source HttpCompress library is very easy to incorporate into an ASP.NET web site. First, download the latest version of HttpCompress from the official web site.
Place the blowery.Web.HttpCompress.dll binary somewhere logical, and add a reference to it.
Next, add the following compression-specific configuration section to your site’s Web.config:
Example 15.5. Web.config (excerpt)


<configSections>

  <sectionGroup name="blowery.web">

    <section name="httpCompress"

        type="blowery.Web.HttpCompress.SectionHandler,

            blowery.Web.HttpCompress"/>

  </sectionGroup>

</configSections>

<blowery.web>

  <httpCompress preferredAlgorithm="gzip" compressionLevel="high">

    <excludedMimeTypes>

      <add type="image/png" />

      <add type="image/jpeg" />

      <add type="image/gif" />

    </excludedMimeTypes>

  </httpCompress>

</blowery.web>
Finally, bring the actual compression HTTP module into the pipeline:
Example 15.6. Web.config (excerpt)


<system.web>

  <httpModules>

    <add name="CompressionModule"

        type="blowery.Web.HttpCompress.HttpModule,

            blowery.web.HttpCompress"/>

  </httpModules>

</system.web>
Once this is in place, you should see compressed ASPX content being returned to the browser. To verify that this is the case, use Port80 Software’s convenient Real-Time Compression Checker.
One limitation of the HttpCompress module approach is that only ASPX content that forms part of your application will be compressed; the CSS and JavaScript aren’t served through the ASP.NET ISAPI handler, and will therefore remain uncompressed. As such, I recommend that you enable compression at the web server level whenever possible, so that these files also gain the benefits of compression.
How can I improve the speed of my site?
Most ASP.NET web servers perform a lot of unnecessarily repetitive work.
For example, suppose you have a page with a DataGrid bound to a table called Products. Every time a user requests the Products page, ASP.NET has to:
- Look up the products data in the database.
- Process the page.
- Databind the product data.
- Render the results to HTML.
- Output the results to the browser.
If we assume the products list changes infrequently in comparison to how often it is requested by a user, most of that work is unnecessary. Instead of doing all that work to send the same HTML to all users, why not just store the HTML and reuse it until the Products table changes?
Solution
The ASP.NET cache provides the key to efficient storage and reuse of our HTML.
There are several ways to use the cache; we’ll focus on the easiest tricks to get you started, then point you toward some resources that will help you tackle more advanced ways to utilize the cache.
The simplest solution is to use the OutputCache directive on your pages or user controls. For example, the following page will be cached for one hour (3600 seconds). You can refresh the page all you like, but the value of DateTime. Now won’t change until the page is cleared from the cache. Here’s the code that retrieves the current time:
Example 15.7. OutputCacheSimple.aspx (excerpt)


<%@ Page Language="C#" AutoEventWireup="true"

    CodeBehind="OutputCacheSimple.aspx.cs"

    Inherits="chapter_15_performance.Performance.OutputCacheSimple"

%>

<%@ OutputCache Duration="3600" VaryByParam="none" %>

<html xmlns="https://www.w3.org/1999/xhtml">

<head id="Head1" runat="server">

  <title>Output Cache Example</title>

</head>

<body>

  <form id="form1" runat="server">

    <h1>Output Cache Example</h1>

    <div>

      <%= DateTime.Now.ToLongTimeString() %>

    </div>

  </form>

</body>

</html>
Figure 15.5 represents our page at 11:01:41 p.m.

Figure 15.6 shows what it looks like at 11:23:01 p.m.

Notice that the time didn’t change, as the page wasn’t re-rendered.
Now let’s look at a slightly more complex caching example:
Example 15.8. OutputCache.aspx (excerpt)


<%@ Page Language="C#" AutoEventWireup="true"

    CodeBehind="OutputCache.aspx.cs"

    Inherits="chapter_15_performance.Performance.OutputCache" %>

<%@ OutputCache Duration="30" VaryByParam="none" %>

<html xmlns="https://www.w3.org/1999/xhtml" >

<head id="Head1" runat="server">

  <title>Output Cache Example</title>

  <script type="text/javascript">

    var d = new Date();

  </script>

</head>

<body>

  <form id="form1" runat="server">

  <!-- Pausing 5 seconds to simulate a database hit -->

  <% System.Threading.Thread.Sleep(5000); %>

  <h1>Output Cache Example</h1>

  <div>

    Time written by ASP.NET:

    <%= DateTime.Now.ToLongTimeString() %>

  </div>

  <div>

    Time written by Javascript:

    <script type="text/javascript">

      document.write(d.toLocaleTimeString())

    </script>

  </div>

  <div id="divCached" style="margin-top:25px;width=300px;">

    <script type="text/javascript">

      var aspTime = new Date();

      aspTime.setSeconds(<%= DateTime.Now.Second %>);


      // If there are more than two seconds difference

      // between the ASP.NET render and the javascript

      // evaluation, the page is almost certainly cached.

      if(Math.abs(d - aspTime) > 2000)

      {

        document.write('Probably Cached');

        document.getElementById("divCached").style.backgroundColor =

          "Coral";

      }

      else

      {

        document.write('Not Cached');

        document.getElementById("divCached").style.backgroundColor =

          "Aqua";

      }

    </script>

  </div>

</form>

</body>

</html>
The above page writes out the current time according to both ASP.NET (server side, cached) and JavaScript (client side, not cached). Additionally, if the JavaScript time is more than two seconds after the ASP.NET time, the page will report that it has probably been cached.
The first time this page is viewed, there’s a five-second delay (due to the call to Thread.Sleep), then the page shown in Figure 15.7 is displayed.

But if you refresh the page within 30 seconds, you’ll notice two differences. First, the page will return immediately. Second, it looks like Figure 15.8.

Using VaryByParam to Cache Parameterized Pages
When you start to consider which pages in your application could be cached, you’ll probably discover that many of them contain content that’s 90% static. The remaining 10% of these pages is likely to contain one or two tiny portions that vary frequently. For example, consider a page in the example Northwind database that displays catalog information, including products filtered by category. The category is set by a parameter in the query string, so the following two URLs will yield different results:
http://www.contoso.com/Northwind/Products.aspx?Category=Seafood

http://www.contoso.com/Northwind/Products.aspx?Category=Produce
The novice programmer might apply the following code to cache these pages:
<%@ OutputCache Duration="30" %>However, if you were to apply this code you’d quickly discover a problem — the category filter would stop working. The first version of the page that was displayed would be cached, so the filtering logic would be ignored on subsequent page views.
That’s the exact function for which the VaryByParam attribute is used. In this case, we’d change the OutputCache directive to the following:
<%@ OutputCache Duration="30" VaryByParam="Category" %>The VaryByParam attribute tells the cache system to store a different version of the page every time it sees a new value for Category in the URL. Once this attribute is in place, our users will be able to access a cached copy of the page for both the Seafood and Produce categories.
Keep in mind that storing different versions of the page for each parameter value isn’t always the best idea — in cases where you have many different parameter values, you can quickly use a large amount of memory to hold all possible variations of the page. Use VaryByParam when your pages utilizes a limited number of parameter values.
Note that the number of seconds displayed in the JavaScript-generated time has updated to 59 seconds, while the ASP.NET time still shows 39. What this discrepancy suggests is that the server is sending the same HTML to the client for each request. Suppose that instead of just displaying the current time, we’d bound several GridViews to the results of several expensive database queries. With caching applied to such a page, the savings would be considerable.
You don’t have to cache a page for long to see significant performance increases — a cache of one minute or less can improve your site’s performance dramatically. For example, adding a cache to a simple page that just binds a GridView to the Products table in the example Northwind database will increase the performance of that page by about 500%, and for a page that performs a complex database query or processor-intensive calculation, this saving is likely to be amplified even further.
Using Post-cache Substitution
While the OutputCache directive allows you to specify that the cache should vary with a specific parameter, it’s not really efficient to cache a multitude of copies of one page that are nearly all identical.
Post-cache substitution, using the Substitution control, allows you to inject dynamic content into a cached page. The result is that you can cache some pages that you probably thought were unable to be cached. Read more on this subject in Scott Guthrie’s article on the topic.
One of the problems you might notice with this approach, however, is latency — the time delay between the point at which your data is updated and the moment when that same updated data reaches a user’s browser. In the examples we’ve looked at in this solution, we displayed the same timestamp for 30 seconds after the page was rendered — this is great for performance, but might be a problem if your users require the data to always be up to date.
Fortunately, ASP.NET 2.0 has a solution to this problem, which we’ll look at next.
How do I refresh my cache when the data changes?
As we saw in the previous tip, judicious use of output caching can provide dramatic improvements in your site’s performance. Output caching works by saving the generated HTML for a rendered ASP.NET page. As long as the cache is valid, future requests for that page will just return that stored HTML, rather than processing the page again, which means no page parsing, hits to the database, data binding — any of those tasks that require precious bandwidth or processor cycles. Used correctly, caching can improve your requests-per-second on a high-traffic page by a factor of 100 or more.
For example, suppose you had a page that contained a DataGrid bound to a table called Products. Without caching, every page request would require ASP.NET to look up the product data in the database, process the page, data bind the product data, render the results to HTML, and output the results to the browser.
If the page was cached, only the first request for this page would require all that work; after that, ASP.NET would just skip all the hard work and serve up the HTML until the cache expired. The end result would be the same whether or not a cache was used: the same HTML would be sent to the browser. However, since a lot less work and network traffic is required to display cached HTML, the server can serve the cached page much faster and to more people.
One problem with cached pages is that they don’t pick up data that has changed right away. To continue with the example above: if we were to add a new product to the Products table, it wouldn’t show up on the page until the cache expired. Fortunately, ASP.NET 2.0 provides a good mechanism to refresh your cache automatically when the underlying data changes.
Solution
The SQL Cache Dependency was created to solve this problem. A few steps are required to set it up, but once it’s up and running, you can use it throughout your whole application.
Using SQL Cache Dependencies with Older Versions of SQL Server
In this book I’ll only cover the steps for configuring SQL Server Cache Dependencies on SQL Server 2005; there’s a wealth of information on MSDN about how to set it up on SQL Server 2000:
- ASP.NET SQL Server Registration Tool (Aspnet_regsql.exe)
- Caching in ASP.NET with the SqlCacheDependency Class
- Walkthrough: Using ASP.NET Output Caching with SQL Server
First, you’ll need to make sure you’ve enabled SQL Server Service Broker for your database. You can confirm that with the following query:
ALTER DATABASE Northwind SET ENABLE_BROKER;Next, you’ll need to start the SQL Dependency event listener. The recommended place to make the change that triggers this listener is in the Application_Start method of Global.asax:
Example 15.9. Global.asax (excerpt)


void Application_Start(object sender, EventArgs e)

{

  string northwindConnection = WebConfigurationManager.ConnectionStr

➥ings["NorthwindConnectionString1"].ConnectionString;

  SqlDependency.Start(northwindConnection);

}
Once the above code has been added to the Global.asax file, our connection can employ an SQL Cache Dependency.
To illustrate how an SQL Dependency is utilized, let’s look at an example — a simple GridView that’s bound to a table. We’ll drag the good old Northwind Products table onto a new page, then set the following two attributes in the SqlDataSource control:
EnableCaching = "True" SqlCacheDependency =

    "NorthwindConnectionString1:Products"
With this simple line of code in place, the GridView won’t read the Products table again until it changes. As soon as the Products table changes, though, SQL Server will notify ASP.NET to dump the cache, and the subsequent page request will reload the page from the database. The end result is that our application gains all of the performance benefits that come with caching, but our users will never see stale data.
How can I gain more control over the ASP.NET cache?
As we’ve seen, declarative caching provides a great return on investment — it’s very easy to enable, and will give you some immediate performance benefits. However, you can gain even more benefit from the ASP.NET cache with only a little more work.
Solution
If you’d like to really take advantage of caching in ASP.NET, it’s time you met the Cache API. Declarative caching might be easy to set up, but it can only take you so far. Unlike declarative caching, which stores and reuses rendered HTML, the Cache API allows you to store data efficiently in your application logic or code-behind code.
The simplest way to think of the ASP.NET cache is to compare it to the Application object. They’re similar in that you can use both to store objects or values by a string key:
Cache["States"] = new string[] {"Alabama","Arkansas","Alaska"};

Cache["ProductData"] = GetProductDataset();
So what’s the difference between the Application object and the cache for the storage of information? ASP.NET can remove items from the cache whenever it needs to free up memory. The cache has a limited amount of memory to work with, so when new content is added to the cache, the cache usually has to delete some older, cached data.
Different classes of information can be stored in your cache:
- Expensive data is information that you want to keep in the cache whenever possible. The term “expensive” refers to the fact that the generation of this class of data involves valuable resources (database or processing power).
- Inexpensive data refers to all of the other types of information that you’d like to put in the cache if there happens to be room, but is not particularly resource-intensive to generate.
The challenge is to prevent the inexpensive data from pushing the expensive data out of the cache.
The Cache object comes with some features that give you some control over which items are placed in the cache, and how long they stay there. Using the Cache object, you can apply custom cache dependencies, explicitly set cache expiration policies, and define callback events that fire when an item is removed from the cache (so you can decide whether you’d like to add it to the cache again).
One of my favorite features is the sliding expiration, which is a setting that lets you specify that an item should stay in the cache — as long as it has been used within a certain period of time:
Cache.Insert("ProductData", GetProducts(), null,

    System.Web.Caching.Cache.NoAbsoluteExpiration,

    TimeSpan.FromMinutes(10));
The above code tells the cache that we’d like it to keep our Products data set, as long as it has been used in the past ten minutes. The benefit of this approach is that frequently used data will stay cached, and infrequently used data will expire and stop taking up valuable space.
We can customize the settings for our cache, for example, setting a longer sliding expiration timeframe on data that’s more expensive (such as that which results from a web service call). We could even add a cache dependency on the results of a GetLastUpdateTimestamp web service call to keep the data current if needed. Remember, though, that any data can still be removed from the cache at any time — our sliding expiration time setting is really just a suggestion to the cache system.
Discussion
Once you’ve begun to cache your data, you’ll begin to see the benefit of what are some tried and true cache access patterns. Steven Smith wrote about the cache data reference pattern in his excellent MSDN article. Here’s some code that implements this pattern:
public DataTable GetCustomers(bool BypassCache)

{

  string cacheKey = "CustomersDataTable";

  object cacheItem = Cache[cacheKey] as DataTable;

  if((BypassCache) || (cacheItem == null))

  {

    cacheItem = GetCustomersFromDataSource();

    Cache.Insert(cacheKey, cacheItem, null,

        DateTime.Now.AddSeconds(GetCacheSecondsFromConfig(cacheKey),

        TimeSpan.Zero);

  }

  return (DataTable)cacheItem;

}
Smith’s article explains the technique in more detail, but the most important point to note is the possibility that the object may not be in cache, or could potentially be removed at any time. The above code is safe because it loads the cached object, checks whether the object is null, and, if so, loads the object data and adds it back to the cache.
Another of my favorite cache patterns is one that Gavin Joyce uses on his DotNetKicks site — the reluctant cache pattern, which relies on his ReluctantCacheHelper class. This pattern prevents an application from adding to the cache information that’s unlikely to be used.
For example, when Google indexes your site, it will load every page that it can find. If your site implements a cache that is used by a large number of pages, your server will perform a lot of unnecessary work adding data to the cache, only for that data to be immediately dropped from the cache as other pages are added. Similar to the sliding expiration pattern, but in reverse, this pattern only adds data to the cache if it’s been used a lot recently. Here’s an example that implements this pattern:
public static List<Customer> GetCustomers() {

  string cacheKey = "Customers";

  int cacheDurationInSeconds = 5; // low number for demo purposes

  object customers = HttpRuntime.Cache[cacheKey] as List<Customer>;

  if (customers == null) {

    customers = CustomerDao.GetCustomers();

    if (new ReluctantCacheHelper(cacheKey,

        cacheDurationInSeconds, 2).ThresholdHasBeenReached)

    {

      HttpRuntime.Cache.Insert(cacheKey,

          customers,

          null,

          DateTime.Now.AddSeconds(cacheDurationInSeconds),

          System.Web.Caching.Cache.NoSlidingExpiration);

    }

  }

  return (List<Customer>)customers;

}
How do I speed up my database queries?
We’ve looked at a few ways to optimize your ASP.NET code, but if your queries are slow, you’ll still have a site that drags its heels. You can hide the problem to some degree if you cache your data or add servers to your web farm, but eventually you will need to deal with your slow queries.
Of course, the best bet is to work with a good Database Administrator (DBA). We’re ASP.NET developers, and while we can’t help but learn about databases as we work with them, database administration is not our full-time job. A good DBA is by far the best solution to a database problem, but sometimes, it’s just not an option. If you work on a team without a DBA, or you have limited access to your DBA, you need to do your best to solve problems when you can.
Slow Query or Slow Database?
It’s important to decide whether you’re dealing with one slow query or a whole slow database. Is one particular page slow, or is the whole site groaning? This solution will focus on the former; if you can narrow your database performance problems down to individual queries, refer to the section called “How can I troubleshoot a slow query?” later in this chapter.
Solution
Use the SQL Profiler and Database Tuning Advisor, located in the SQL Server Performance Tools folder.
Tuning a database server is hard. Initially, it can be difficult to find out what’s responsible for slowing things down. Even then, fixing one problem (for example, applying indexes to a table to improve the speed of SELECT statements) can introduce new problems (such as slower INSERTs and UPDATEs).
Fortunately, the existence of the SQL Performance Tools means you don’t have to bother with guesswork.
The SQL Profiler captures what’s going on in your database, including which SQL statements are being executed, who’s executing them, and how long they’re taking. The profiler is the first step to determining what’s actually happening on your server.
Note that the profiler captures both ad hoc and dynamic SQL. This means that the profiler is especially useful when control, library, or framework code is making a call in your database — you may not have access to the ASP.NET code, but the profiler will reveal exactly which queries are being executed, and how long they are taking.
It’s best if you can run a profiler trace on your actual production system, but this may not always be possible — profiling a server slows the server down, and the site’s regular users may not appreciate the extra delays. If you can’t run on the production system, you can still gain a reasonable idea of server activity on a local or development server by simulating the way real users would using your site on the live server.
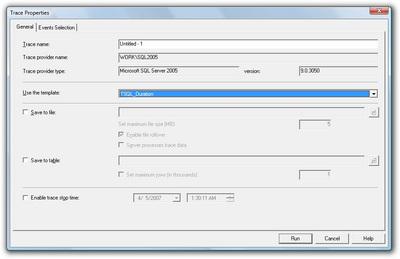
Running the profiler can be a bit daunting the first time — there are numerous advanced settings to monitor and tweak. It’s best to start out with a predefined template like the one I’ve chosen in Figure 15.9. The two most useful templates for general performance diagnostics are the TSQL_Duration and Tuning templates.
The TSQL_Duration template is useful for giving you a quick snapshot of the queries and stored procedures that take the longest time to execute. Figure 15.10 shows some sample queries running against the Northwind example database. The slowest query — the query with the greatest duration value — is highlighted at the bottom of the list.
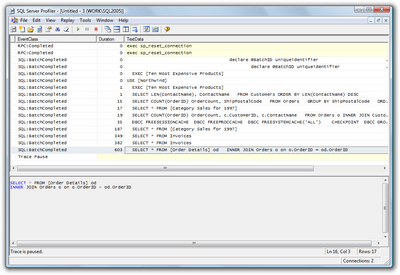
In a simple case like the one above, you may be able to deduce enough information from the TSQL_Duration trace to begin tuning a specific query. If you’re at all in doubt, however, it’s best to run the profiler with the Tuning template and analyze the results in the Database Tuning Advisor (also referred to as the DTA), a tool for analyzing database performance and suggesting which tables should be indexed.
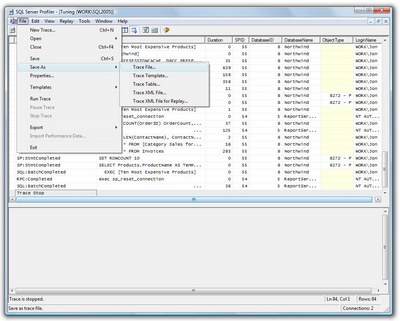
To do this, first save your trace file from the profiler, as shown in Figure 15.11.
Now, we’ll use the DTA to open the trace file that we just saved, as I’ve done in Figure 15.12, and click the Start Analysis button.
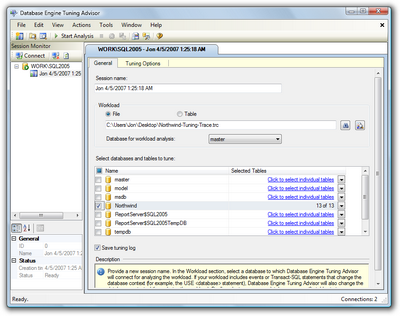
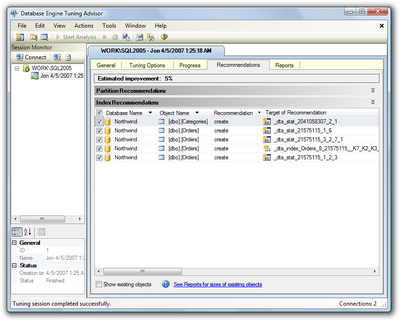
For my sample queries, DTA recommended that I apply a few indexes, to produce an estimated performance improvement of 5%, as shown in Figure 15.13. (The Northwind database is already more or less indexed; your estimated improvement should be a lot higher, with any luck.)
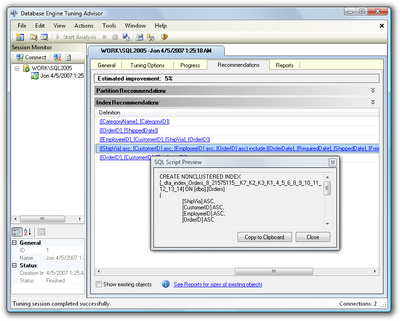
If you scroll to the right, so that the Description column is visible, you’ll see exactly which indexes and statistical changes the DTA recommends. Click on a recommendation to see a preview of the script that will add the proposed index, as shown in Figure 15.14.
To implement these changes, I suggest you save the recommendations (Actions > Save Recommendations…), review them in SQL Server Management Studio (SSMS), and apply them if you feel comfortable with them. Once you’ve done this, repeat your original profiling test and verify that the changes have improved your database performance.
Running the DTA with a SQL Workload Script File
Our walkthrough of the DTA used a SQL Server Trace file for the workload, but you can also use the DTA against a SQL script. Here’s an abbreviated copy of the script I used for this walkthrough:
Example 15.10. SampleSqlWorkload.sql (excerpt)


USE [Northwind]

GO

SELECT * FROM [Order Details] od

INNER JOIN Orders o on o.OrderID = od.OrderID

GO

SELECT * FROM [Category Sales for 1997]

GO

SELECT * FROM Invoices

GO

SELECT COUNT(OrderID) OrderCount, ShipPostalCode

    FROM Orders

GROUP BY ShipPostalCode

ORDER BY COUNT(OrderID) DESC

GO

EXEC [Ten Most Expensive Products]

GO

SELECT COUNT(OrderID) OrderCount, c.CustomerID,

    c.ContactName

FROM Orders o INNER JOIN Customers c

    ON o.CustomerID = c.CustomerID

GROUP BY c.CustomerID, c.ContactName

sORDER BY COUNT(OrderID) DESC

GO

SELECT LEN(ContactName), ContactName

FROM Customers ORDER BY LEN(ContactName) DESC

GO
The important point to note is that there are GO separators between statements, which ensures that they’re executed independently. You’ll want your SQL workload script file to simulate actual usage, which means that you should include repeated calls to the most commonly used queries.
Using the Performance Dashboard
SQL Server includes Dynamic Management Views (DMVs) — database views that contain lots of useful management and troubleshooting information about your database. All the DMV views begin with the prefix sys.dm_; for example: sys.dm_index_usage_stats.
SSMS includes some built-in reports that leverage SQL Server Reporting Services as well as the DMVs. You can view these reports in SSMS if you right-click a database and select Reports > Standard Reports….
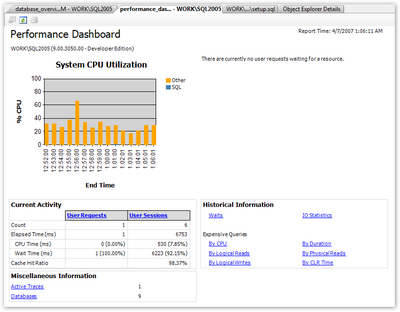
SQL Server SP2 includes the ability to include custom reports, and one of the first to be released is the Performance Dashboard. Once it’s installed, the Performance Dashboard gives you a graphical snapshot that’s visible in your browser, without you having to run a trace. Figure 15.15 shows the dashboard in action.
Discussion
One important aspect of troubleshooting a slow database is to understand what’s making it run slowly. There are many potential causes of slow performance, but some common problems head the list. Let’s look at a few of them.
Lack of Indexes
The ability to index data is one of the key benefits of storing information in a database. Imagine for a moment that you need to look up a name in a telephone book. You take advantage of the fact that the last names are sorted in alphabetic order — it would take forever to find a name if the entries were listed in random order. Databases take advantage of the way your information is sorted for the same reason. The default sort order in a table is called a clustered index.
Of course, you may want to search for your information in several different ways. To continue with the phone book example, you may want to look up businesses by zip code, business type, or name. The common approach to implementing this capability in a database is to order the data based on the most common search order, then place additional indexes to facilitate other search criteria. The data is sorted by the clustered index, but the database stores additional information to help it look up rows using other criteria. This additional lookup information is called a non-clustered index.
One of the most common reasons for slow queries is that the database is performing a table scan, which occurs when the database lacks an appropriate index to use to look up data. Asking your database to perform a table scan is equivalent to asking someone to look up a person in a phone book that lists entries in random order. To summarize, proper indexes are a necessity for database performance.
Incorrect Indexes
If indexes are good, more indexes are great, right?
Actually, no. There’s a cost incurred when you add indexes to a database. Each time a row is added or updated, all the indexes need to be updated, and too many indexes can slow your database down. It’s important to select a limited number of indexes that’ll give you quick lookups without slowing down your updates. We’ll be talking about some tools to help you with this task later in this chapter.
Poorly Written Queries
It’s easy to land yourself in trouble if you don’t really understand SQL. SQL is not just another programming language — it’s a declarative, set-based query language. A lot of your standard programming tricks don’t apply here.
We’ll talk about troubleshooting query plans and poorly written queries in the section called “How can I troubleshoot a slow query?” later in this chapter.
Deadlocks
Databases use locks to prevent your data from being messed up by conflicting updates.
For example, we can’t apply a 10% discount to all of our product prices and delete all products that are priced over $100 at the same time — we need to process one product at a time. Locks allow us to do this. The SQL Server engine is reasonably clever about how it uses database locks — it’ll often lock portions of a table (called pages) and, sometimes, individual rows.
Yet there’s always the potential for two transactions to arrive at a state where both are waiting for the freeing of a lock that’s simultaneously held by the other transaction. This situation is called a deadlock.
For example, consider two queries that use the Products and Orders tables. The first query, which we’ll call ProductsThenOrders, uses the Products table first; the second query, OrdersThenProducts, uses the Orders table first.
ProductsThenOrderslocks the Products table and begins to make updates. Meanwhile,OrdersThenProductslocks the Orders table and performs its updates. No problems so far.
Now ProductsThenOrders is ready to update the Orders table, but it can’t — the other query has it locked. Likewise, OrdersThenProducts wants to update the Products table, but is also blocked for the same reason. We’re deadlocked!
When SQL Server eventually detects a deadlock, it will pick one query as the “deadlock victim” and kill it, while the survivors are released. The result of this conflict resolution process is that one of the queries will return with an error that it was unable to complete — not the most efficient use of resources.
Deadlocks don’t happen too frequently — unless your application executes a lot of transactions. It’s important to be aware of them and to fix deadlock conditions quickly. Deadlocks can be avoided by:
- minimizing transaction length
- accessing tables in the same order in competing queries
In the above example, accessing the Products table first in both queries would have prevented the deadlock.
The NOLOCK Query Optimizer Hint
Even if you’re not encountering deadlocks, locks have a definite performance impact. Locks restrict access to your data in such a way that only one query can use it at any time — an approach that’s safe but slow.
In some cases, you mightn’t need to lock your rows. You might query historical data that isn’t subject to change, or it mightn’t be crucial that the data returned in the query is perfectly up to date — comments on a weblog might fall into this category.
In these cases, you can use the NOLOCK hint to tell SQL Server you want to read directly from the table without honoring any locks. Note that this only makes sense for SELECT statements — any data modification will always require a lock. Best practices avoid using table hints — parameters that override the default behavior of a query — when possible. However, this one is relatively innocuous as long as you understand that you may be viewing uncommitted changes. Just don’t use it when displaying critical information, such as financial data.
Here’s how you’d use it:
SELECT COUNT(1) FROM Orders WITH (NOLOCK)Since this statement places no locks on the data that it’s reading, other queries won’t be forced to wait for the query to complete before they can use the Orders table.
You can read more about deadlocks in the MSDN article, “Analyzing Deadlocks with SQL Server Profiler.”
Hardware Issues
As with any software application, SQL Server performs at its optimum when it’s running on sufficiently powerful hardware.
If upgrading your server is an option, the first thing you should look at is memory, as SQL Server makes heavy use of available memory to cache frequently used data. And the cost of new memory is relatively cheap — often cheaper than the time required to tune an underpowered database server. Adding memory can compensate for slow CPU or drive access, since caching can significantly reduce the work that SQL Server needs to complete.
After you’ve exhausted your memory upgrade options, the next most common hardware issue is a disk read/write bottleneck. Database hardware configuration is a large topic and falls well beyond the scope of an ASP.NET book, but a great first step is to put your log files on a drive that’s as fast possible, and is separate from the operating system and database files.
Using a production database server for other tasks — especially IIS — is a bad idea. It’s often necessary in a development environment, but it will have a performance impact in production.
How can I troubleshoot a slow query?
Optimizing database performance is a complex topic that’s the subject of numerous very thick books, so I’m not going to pretend that we can make you an expert in query optimization in a few short pages. Instead, I’ll focus on some of my favorite “developer to developer” tips to point you in the right direction.
Solution
Before you begin to look for a solution, it’s important to verify the problem at hand. You can then begin the process of elimination.
Verifying the Problem
First, verify that the SQL you think is being executed is actually being executed. The best way to confirm this is to duplicate the problem: run the query in SQL Server Management Studio (SSMS).
If you have any doubt about which SQL commands are being executed, run the SQL Profiler for confirmation (see the section called “How do I speed up my database queries?” earlier in this chapter for details on using the SQL Profiler). This tool is especially helpful when used with applications that make use of declarative data binding, or with frameworks that handle data access for you.
Clearing the SQL Cache when Testing in SSMS
SQL Server uses an intelligent caching system to enhance performance. If you run frequent queries against a certain table, SQL Server will recognize that fact and store the source (and result data) of those queries in its internal cache. By doing so, future matching queries won’t need to look up this data until the next time it changes.
This functionality, while useful, can be confusing if you conduct your tests by running your queries from SSMS — some of your query information may be cached, so your queries will run faster the second time you execute them.
To ensure that you make valid comparisons that don’t return cached information, clear your cache each time you run the query. The following script does just this — first it drops caches, then it calls a CHECKPOINT to flush pending changes from memory to disk, and finally it clears any data that has been stored in memory:
DBCC FREESESSIONCACHE

DBCC FREEPROCCACHE

DBCC FREESYSTEMCACHE('ALL')

CHECKPOINT

DBCC DROPCLEANBUFFERS

GO -- Your query goes here
Once you’re able to duplicate the problem in SSMS, you can dig into the query itself.
Checking for Large Result Sets
If your query returns more rows than you expected it to, there are two main problems to look at — cross joins and incomplete WHERE clauses.
A cross join occurs when you fail to specify a join correctly. Here’s an example:
SELECT * FROM Customers, Orders, [Order Details], ProductsIn the above query, we haven’t specified how the tables should be joined, so the SQL interpreter will attempt to return every possible combination. That means that our result set will include every Order combined with every Customer (not just the Orders that each Customer made). So this query returns about 12.5 billion rows (91 Customers × 830 Orders × 2155 Order Details × 77 Products) — that’s roughly 7.5GB of data.
That return is obviously way out of line, considering there are only 830 orders in the system. Of course, this is a slightly exaggerated example for demonstration purposes, but it’s easy to see how a single cross join can waste a lot of database resources (CPU and memory) and delay network traffic between the database and web server.
An incomplete WHERE clause isn’t quite as bad, but can still return more rows than you need. The following query returns 2155 rows:
SELECT * FROM [Order Details]This one, on the other hand, returns three rows:
SELECT * FROM [Order Details] WHERE OrderID = 10252ADO.NET makes it really easy to filter your data on the server, but unfortunately this feature is a double-edged sword — it can mask problems with a large result set. That’s why it’s important to verify the problem with real, systematic measurement rather than just assume that a Gridview displaying only a handful of rows couldn’t possibly be the source of the problem.
Checking the Query Plan
If your query is indeed returning the correct number of rows, but still takes too long, the next step is to look at the query plan, which is a visual representation of the steps that your query takes to return its result set.
You can view the estimated query execution plan in SSMS if you first select the query, then select Display Estimated Execution Plan from the Query menu (tor use the toolbar button or the keyboard shortcut — Ctrl-L). You’ll also have the option to include the actual query execution plan (also available from the Query menu, the toolbar, and via the keyboard shortcut Ctrl-M). The actual plan is a little more accurate than the estimated one, but requires that you actually execute the query and wait for it to complete.
Let’s look at the actual execution plan for the uspGetBillOfMaterials stored procedure in the AdventureWorks sample database that comes with SQL Server. Enter the following text in the SSMS query window, then turn on the Include Actual Execution Plan option and execute the query:
EXEC dbo.uspGetBillOfMaterials 800, '2001-01-09'Figure 15.16 shows the result.
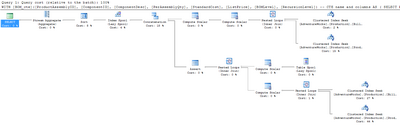
Figure 15.17 shows a close-up of the bottom right-hand corner of our plan.
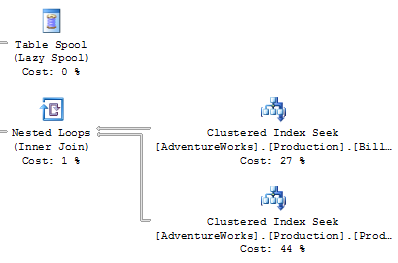
You’ll need to look for a few important things when you’re analyzing an execution plan:
- Thick lines in the execution plan indicate large amounts of data being passed between steps. I was once troubleshooting an extremely slow summary report query that returned only a dozen rows. When I looked at the execution plan, I saw that some of the lines between steps were an inch thick — this indicated billions of rows being passed between those steps, which were then filtered down to the final dozen rows displayed in the browser. The solution was to modify the query to ensure that the data was filtered as early as possible.
- Large percentage numbers indicate the most expensive operations — the value of 44% in Figure 15.17 is one example of this.
- If one of the steps on your plan contains the word “scan” (or, in particular, “Table Scan”), this is an indication that the SQL engine had to step through every row in a table to find the data that it was after. This is usually associated with a high Cost value. There are occasions when a table scan is acceptable — such as when you’re performing a lookup against a very small table — but in general they’re best avoided.
If you see a problem, you can troubleshoot it in SSMS: modify the query and view the effect of your change on the execution plan.
If it looks as though your issue may be the result of an indexing problem, the best solution is to right-click the query and select Analyze Query in Database Engine Tuning Advisor. The DTA will launch with all the necessary options preselected, so all you need to do is click the Start Analysis button. Figure 15.18 shows the results of one such analysis.
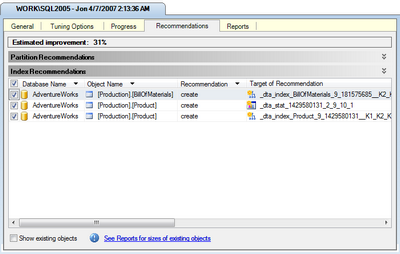
As you can see, the DTA has recommended two index changes and one statistical change that should improve this query’s performance by 31%. Of course, you’ll need to consider the effect that these additional indexes will have on updates to the affected tables. In this case, since the tables in this particular example are probably updated rather infrequently, I think that these new indexes make sense. You can apply or save these changes via the Actions menu.
Eliminating Cursors
You’ll want to look for and eliminate any unnecessary cursors — pointers for traversing records in the database.
Cursors let you write in a procedural style, applying logic to a single table row at a time. While it can be tempting to drop back to those skills that are most familiar to you in sticky situations, cursor-based queries will prevent the database engine from taking advantage of the index optimizations and set-based operations for which it was designed.
Resist the urge and get rid of your cursors!
I’ve written a lot of SQL in ten years of professional programming, and I’ve yet to encounter a case where cursors were required. I recently rewrote someone else’s complex query from using cursors to standard SQL, and the time for the resulting operation dropped from eight hours to just over one minute.
Think about how to describe the problem as a bulk operation. For example, suppose your mode of thinking about a query was something like this:
“I’ll loop through the orders table, get the product ID, then grab the price, and compare it to …”
Instead, consider rephrasing it to something like this:
“I want to find all orders for products that have prices greater than a certain amount …”
Remember that you can use common table expressions (CTEs), table variables, and temporary tables if you’re stuck. While these fallback options aren’t as efficient as performing a bulk operation, they at least allow the query engine to make use of indexes.
The Problem with SELECT *
Most developers will tell you that SELECT * queries are bad, but for the wrong reason.
The commonly understood reason is that SELECT * is wasteful because it returns columns that you don’t need. While this is true, most normalized tables don’t contain that many columns, so these extra rows usually won’t have a noticeable impact on your site’s performance unless they number in the millions.
Often, the bigger problem with SELECT * is the effect it will have on the execution plan. While SQL Server primarily uses indexes to look up your data, if the index happens to contain all of the columns you request, it won’t even need to look in the table. This concept is known as index coverage.
Compare the following two queries (against the sample AdventureWorks database):
SELECT * FROM Production.TransactionHistoryArchive

  WHERE ReferenceOrderID < 100

SELECT ReferenceOrderLineID FROM

    Production.TransactionHistoryArchive

  WHERE ReferenceOrderID < 100
In both cases, we’re returning the same number of rows, and the SELECT * query only returns 15KB more data than the second query. However, take a look at the execution plans shown in Figure 15.19.
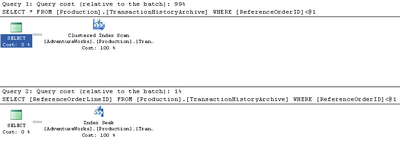
You’ll notice that the first query took 99% of the relative work for both queries. The second query was able to look up the values in the index via an index seek — a search that touches on only those rows that qualify. The first query, however, had to scan all the rows in the table. In this case, the fact that the requested columns were all contained in the search index resulted in a performance difference of nearly one hundred-fold.
It’s important to include commonly queried data in your indexes — something that’s simply not feasible if you’re using SELECT *. If you just query the rows you need, the DTA will be able to recommend indexes to cover them.
Accessing More Information
There’s a plethora of resources to which you can turn when you’re stuck on a really difficult SQL database issue. Here are just a few of them:
- The Microsoft TechNet article on troubleshooting performance problems in SQL Server 2005
- SQLTeam.com — one of many SQL Server community forums
- The SitePoint Databases Forum
Summary
Performance optimization is an iterative process — be prepared to follow the repetitive steps of analyzing your site’s performance, tuning your application, analyzing the performance again, then tuning some more, until your site performs the way you want it to. Premature optimization — tuning without understanding what’s causing the slowdown — is likely to cause more problems than it solves.
ASP.NET and SQL Server 2005 power some of the most popular and powerful sites upon the planet, including MySpace, which serves billions of page views per day. You’ve got all the tools you need to get the maximum possible use out of your web server — I hope the tips in this chapter will help you to put them to work.
That’s it for this chpater of The ASP.NET 2.0 Anthology, 101 Essential Tips, Tricks & Hacks. Feel free to download this chapter — along with three others — for offline reference.
Frequently Asked Questions (FAQs) about ASP.NET Performance Tips
Why is my ASP.NET application running slow?
There could be several reasons why your ASP.NET application is running slow. It could be due to inefficient coding practices, lack of proper indexing in the database, or even server issues. It’s important to identify the bottleneck in your application. Use performance profiling tools to identify slow-running methods or queries. Once identified, optimize your code or queries to improve performance. Also, ensure your server has enough resources to handle the load.
How can I improve the performance of my ASP.NET application?
There are several ways to improve the performance of your ASP.NET application. First, optimize your code by avoiding unnecessary calculations, using efficient data structures, and minimizing network calls. Second, use caching to store frequently accessed data in memory. Third, optimize your database queries by using proper indexing and avoiding N+1 queries. Lastly, ensure your server has enough resources to handle the load.
What is caching and how can it improve ASP.NET performance?
Caching is a technique where frequently accessed data is stored in memory for quick retrieval. In ASP.NET, you can use the Cache object to store data that is expensive to create or retrieve. By using caching, you can significantly reduce the load on your server and database, resulting in improved performance.
How can I optimize my database queries in ASP.NET?
You can optimize your database queries in ASP.NET by using proper indexing, avoiding N+1 queries, and minimizing the amount of data retrieved. Use the Entity Framework’s profiling tools to identify slow-running queries and optimize them. Also, consider using stored procedures for complex queries as they are precompiled and run faster.
What are some common performance issues in ASP.NET?
Some common performance issues in ASP.NET include inefficient coding practices, lack of proper indexing in the database, server issues, and network latency. These issues can cause your application to run slow and provide a poor user experience. It’s important to identify and address these issues to improve performance.
How can I use the Entity Framework to improve ASP.NET performance?
The Entity Framework is a powerful tool that can help improve ASP.NET performance. It provides several features such as lazy loading, eager loading, and query optimization that can help improve performance. However, it’s important to use these features correctly to avoid performance issues.
What is the role of a server in ASP.NET performance?
The server plays a crucial role in ASP.NET performance. If your server lacks the necessary resources to handle the load, it can cause your application to run slow. Ensure your server has enough CPU, memory, and network bandwidth to handle the load. Also, consider using a load balancer to distribute the load across multiple servers.
How can I use ASP.NET MVC to improve performance?
ASP.NET MVC provides several features that can help improve performance. For example, you can use the OutputCache attribute to cache the output of a controller action. Also, you can use bundling and minification to reduce the size of your CSS and JavaScript files, resulting in faster page load times.
What are some best practices for improving ASP.NET performance?
Some best practices for improving ASP.NET performance include optimizing your code, using caching, optimizing database queries, and ensuring your server has enough resources. Also, consider using performance profiling tools to identify bottlenecks and address them.
How can I monitor the performance of my ASP.NET application?
You can monitor the performance of your ASP.NET application using performance profiling tools. These tools can help you identify slow-running methods or queries, memory leaks, and other performance issues. Also, consider using application performance monitoring (APM) tools for real-time monitoring and alerting.
Jeff has been a Microsoft developer since 1992, and is particularly interested in best practices and human factors in software development, as represented in his blog, codinghorror.com. Jon spends most of his time with AS.NET and SQL Server, and was a co-founder of the Monoppix project. He has contributed to several open source projects, including SubSonic, and regularly releases open source utilities. He blogs at http://weblogs.asp.net/jgalloway/.

Published in
·Canvas & SVG·Design·Design & UX·HTML·HTML & CSS·Illustration·UI Design·September 16, 2015

Published in
·Design·Design & UX·Email·HTML & CSS·Mobile·Mobile UX·Resources·Responsive Web Design·UX·Web·November 20, 2014