This article was sponsored by Loggly. Thank you for supporting the sponsors who make SitePoint possible.
When running an application or website, you’d be wise to not only keep track of your visitor statistics, but your performance as well. While we’re used to setting up downtime monitoring right after deployment, this isn’t always the case with performance monitoring. A slow site means a slow income, especially nowadays when visitors expect sites to load in just a couple of seconds.
With excellent tools like New Relic around, application performance monitoring and management shouldn’t be such a hassle anymore. Better yet, they recently teamed up with Loggly, a service that provides log management and analysis for an even better insight into your application or site’s performance. Now you can easily dive further from what happened into how it happened.
In this article I will show you how both New Relic and Loggly work as a combined tool. Once you get the basics I will show you how these two powerful tools combine into a developers dream for analyzing bad performance or downtime.
Why you should use Application Performance Management (APM)
You may have heard of New Relic before as they have had various great partnerships with SitePoint. They were also covered in detail by Darren Jones in his excellent article on real time Ruby monitoring.
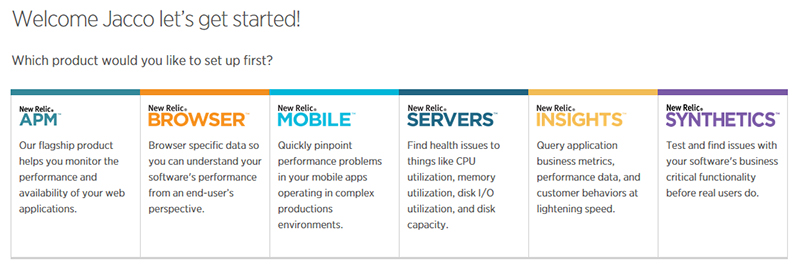
New Relic offers several solutions for application performance management (APM). Whether you want to monitor your web application, mobile app or server, New Relic has the right tools for the job. They also have a free version of all of their products. For this article I will focus on New Relic APM, and let you have a look into its impressive dashboard.
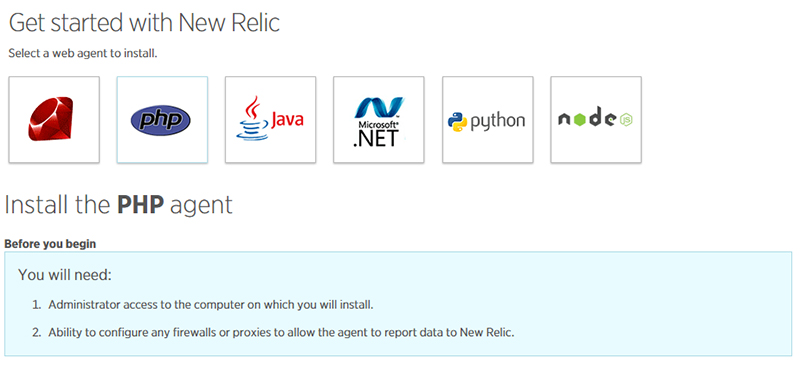
For New Relic to work properly, you’ll need to have admin access to the server your app is running on. Once installed, your dashboard will come alive. After running a small load test you’ll get to see your app (a Magento webshop in my case) in action.
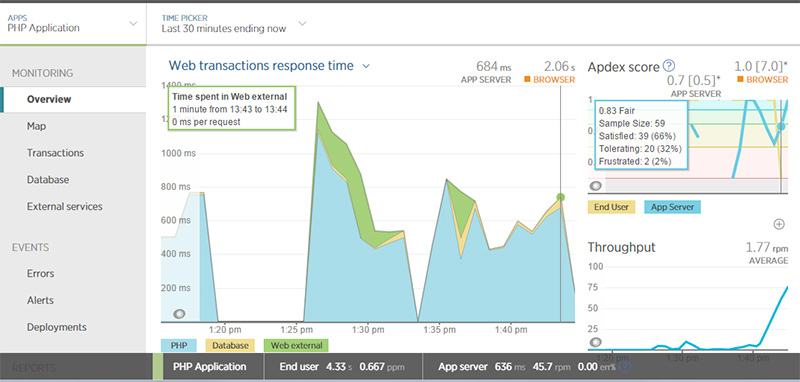
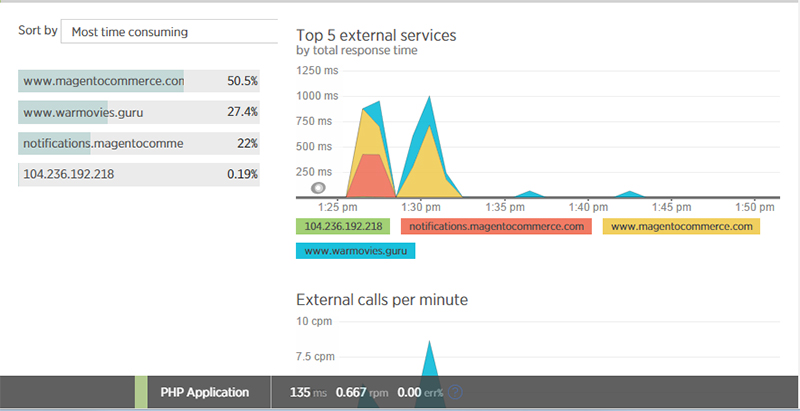
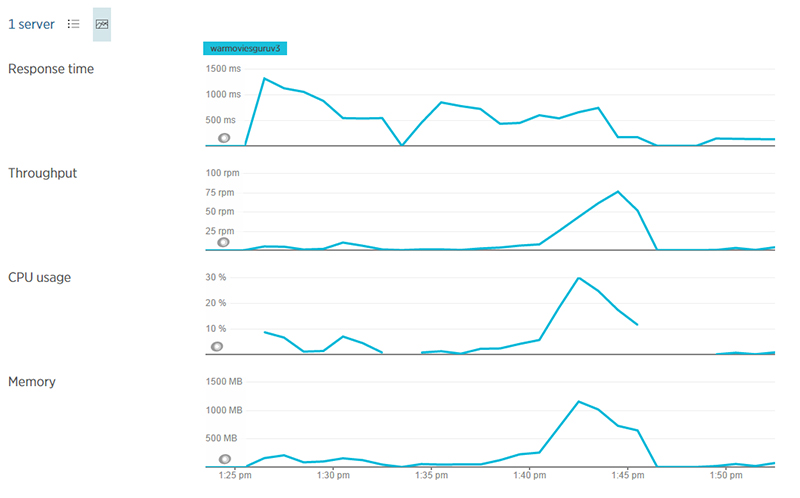
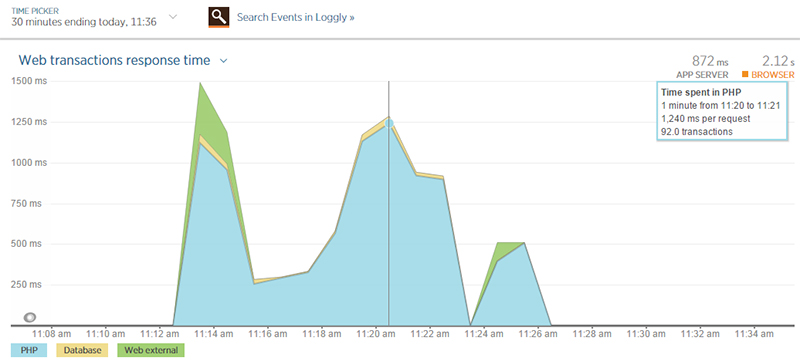
The dashboard shows you the average loading times for your PHP application, the database and external sources (DNS for example). You can also see your throughput (75 requests per minute in this screenshot) and APDEX score (which is basically a satisfaction rate based on an average loading time of 0.5 seconds as default). You can then further zoom in on all of these parameters, like the external sources loading time or database calls.
There is also limited server information with CPU and memory usage, along with throughput and response time. For more extended server monitoring you should use New Relic Servers, but even in limited mode this is still valuable information.
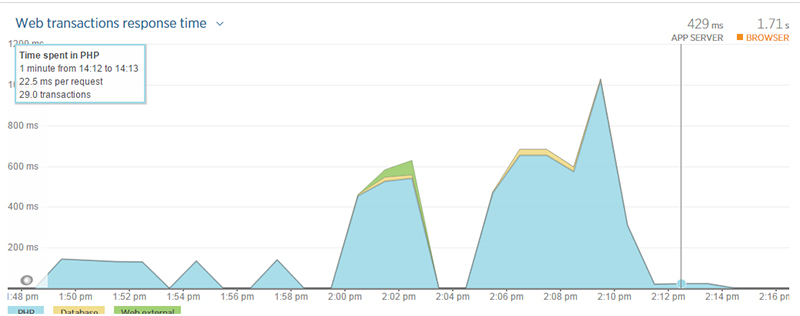
Since New Relic gives you real time reporting, you can instantly see the effect of changes you make. When running a second load test I turned on Magento cache during the test, causing an instant drop in PHP load times as well as fewer database queries. New Relic gives you a nice view of the results right away.
Along with real time reporting there are tons of additional reports for you to run. You can also set up alerts for specific events like downtime or slowdowns.
All in all, New Relic is a great tool for performance testing, but in some cases you’ll want to dive in deeper and look at your logs for detailed analysis. This is where Loggly comes in. It has an integration for New Relic which makes it very convenient to jump from an event from New Relic into logs hosted by Loggly. Let’s have a look.
Why you should value your logs
Loggly is all about log management and analysis, and they provide you with some nifty tools to do this. Setting up is simple, with a couple of commands in the command line. After that, you’re in log heaven. Loggly gives you insight into every detail of your application.
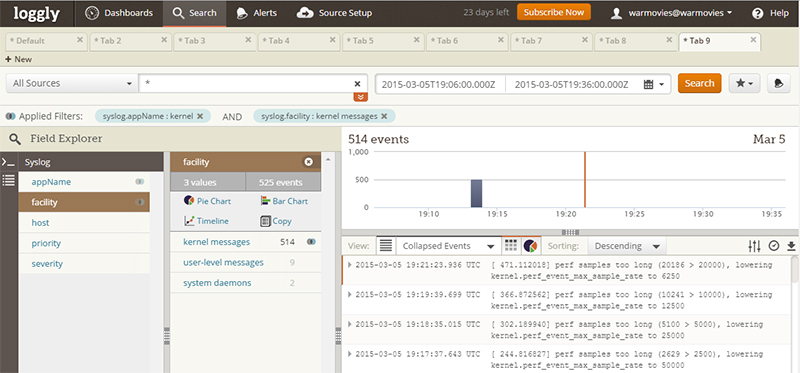
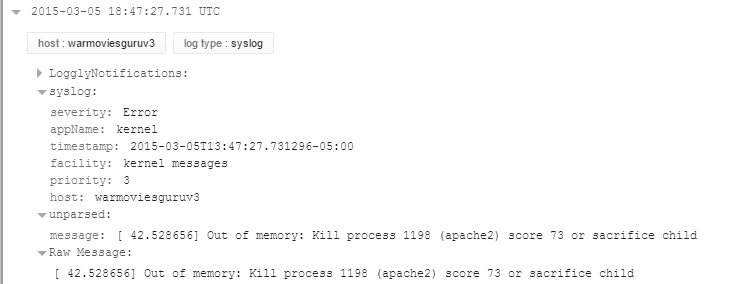
Where New Relic tells you what’s happening on the front-end, Loggly gives you an insight into what’s happening throughout your stack. In my screenshot you can see Loggly is reporting that my instance ran out of memory. New Relic, however, was only showing “lower” or “no” performance, because they don’t measure your server’s memory limit. Without Loggly, I simply wouldn’t have known what happened in this case.
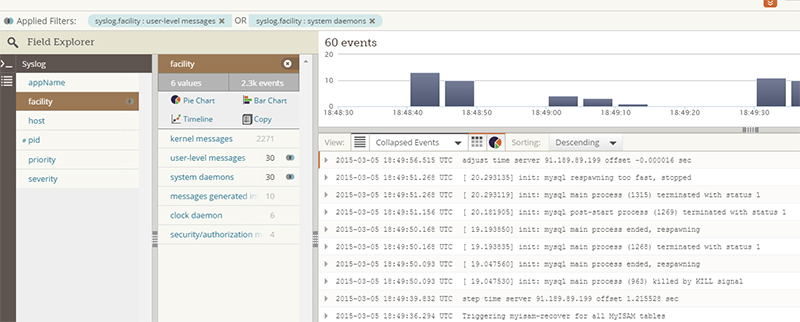
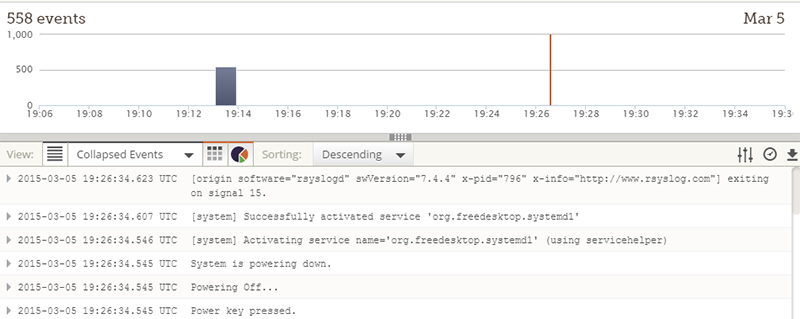
In the screenshot above, you’ll see the logs of multiple restarts in a short time. As you can see Loggly gives you extremely detailed information on the buildup of downtime on various levels. Loggly has a granular approach, as each event is stored separately where New Relic aggregates them.
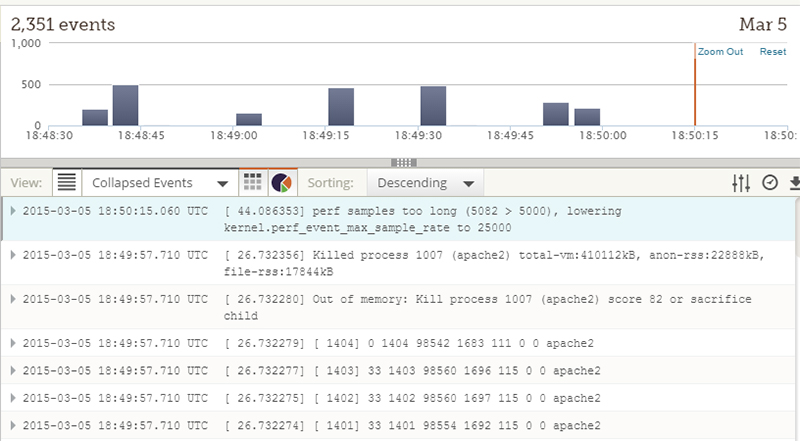
An error or performance issue can have several underlying causes, but New Relic only shows you the end result and its impact. With Loggly you can trace each event back to its origins and see what happened in the moments before it occurred. It also allows you to pinpoint a specific user’s issue for example. Also when browsing through the logs I noticed someone tried to log in as root, an attempt which was blocked. This is all valuable information which New Relic can’t provide and Loggly does perfectly.
Loggly gives you multiple ways of building your own custom dashboards to monitor your apps or even sections of your app or site. You can integrate it with other tools like PagerDuty or HipChat for advanced notification. You can also set up various alerts within Loggly itself and it has an universal search bar to quickly get the relevant logs based on your search terms.
Browsing through tons of logs can be a tedious task, especially when you can’t really pin down what each entry meant on the front-end. To help you in your analysis, New Relic and Loggly teamed up to provide you an excellent integration. Using a Chrome extension, you can simply click on an event reported by New Relic and find the matching logs in Loggly. Let’s see how that works.
Getting the best of both worlds: Combining APM with log management for a detailed breakdown analysis
New Relic and Loggly on their own provide excellent ways of tackling problems in performance. But when doing an analysis you can’t easily put them back-to-back without constant switching. Especially with more popular apps or sites we’re talking in milliseconds, with tens or even hundreds of events and transactions happening each second.
For a solution, install the “New Relic – Loggly Extension“. After you’ve done that, you’ll get an “Search Events in Loggly” button on each error and event screen in New Relic.

Every time you are looking at an event, error or transaction and you hit that button, the exact date and time parameters are passed on to Loggly. This way you’ll get a perfect match in Loggly without further adjustment of time. Loggly then allows you to scroll through its full log so you can see everything that happened before the actual event occurred.
Let’s have a look at a few load tests I did on my demo site. I loaded up the homepage with a number of products and turned the caching off, which leads to a lot of database calls for each visit. I then fired up a load tester (Load Impact) with 50 concurrent users and within a minute the site went down. After the first test I turned the cache back on and ran the same test but this time with 100 concurrent users. Again within a minute the site went down.
After a few minutes New Relic caught up so I could analyse what caused the actual downtime. I expected the database to break right away, but with cache turned on this shouldn’t be the case. Both times there were tens of PHP transactions (100 max at the second test), but in both cases the database was used even when caching was on (this could be due to widgets not being cached, for example).
Hitting the “Search Events in Loggly” button gave me the exact same timeframe so I could start digging. After comparing several events, it turned out that both Apache and MySQL ran out of memory. Apache was mostly responsible with cache turned on, but even then MySQL could be the one to give the final blow.
So the simple solution would be to upgrade the instance the web store was running on. It went from 512MB with a 1 core processor to 8GB with a 4 core processor.
After the upgrade I ran an additional test, with cache turned on and 50 concurrent users. Again database calls were still done, but the performance was pretty consistent (although a bit slow) and there was no downtime.
Loggly was pretty happy too, with the only event being the instance re-sizing. Even though this is a pretty basic example, it does show how easy it is to analyze events in Loggly based on specific moments you see in New Relic. The Chrome extension makes switching a breeze.
That’s really all there is. But even though this sounds simple, it will save you a tremendous amount of time when you want to analyze multiple events. You can get the Chrome extension without additional cost, and setting up takes less than a minute (just enter your Loggly account name).
Get inspired: How you could benefit from APM with log management
New Relic and Loggly are a powerful combination, with both having enough features and tools to quickly analyze a problem and determine its cause. But my demo is just one example. While this is a common issue, finding a quick fix isn’t rocket science. But upgrading your instance is a short term solution as it will keep occurring when your web store becomes more popular.
What if you would want to have a closer look at why there are still database calls even with caching turned on? Or how about a slow performing checkout process, where caching wouldn’t help due the dynamic nature of the actual process?
Conclusion
Both New Relic and Loggly are effective tools to first identify a given problem, then isolate a specific occurrence after which you can reverse engineer the problem and find a solution. Everything is done in (almost) real time and in more detail than you will probably need (but it never hurts to have them).
Loggly has built a great interface for wading through your logs and finding what matters from among their millions of entries. But let’s not forget: they don’t just offer an analysis tool, they also store your logs as well. With a popular app or site your log growth will quickly become insane, sometimes turning into a performance problem on its own. Loggly does all the storing and backing up, so you won’t risk losing your valuable logs after a server has gone completely crazy.
Both New Relic and Loggly have free trials, for 14 days and 30 days respectively. They also offer Lite plans with New Relic having a 24-hour data retention and Loggly 7 days. This is sufficient for real time monitoring with the option for analysis afterwards.
Can you think of some clever uses of New Relic and Loggly? Let us know in the comments.
Frequently Asked Questions (FAQs) about Integrating APM and Log Management with Loggly and New Relic
What is the significance of integrating APM and Log Management with Loggly and New Relic?
The integration of APM (Application Performance Management) and Log Management with Loggly and New Relic is crucial for maintaining the optimal performance of your applications. It allows you to monitor, troubleshoot, and optimize your applications in real-time. With this integration, you can easily track and analyze logs, identify and resolve issues faster, and ensure a seamless user experience. It also provides valuable insights into your application’s performance, helping you make informed decisions to improve its efficiency and reliability.
How does the integration of Loggly and New Relic enhance Magento’s performance?
The integration of Loggly and New Relic with Magento significantly enhances its performance by providing real-time monitoring and analysis of application logs. It helps in identifying performance bottlenecks, detecting anomalies, and troubleshooting issues promptly. This ensures a smooth and efficient operation of your Magento store, leading to improved user experience and increased sales.
What are the steps to integrate Loggly and New Relic with Magento?
The integration process involves several steps. First, you need to install and configure the New Relic APM agent on your server. Then, you need to set up Loggly for log management. After that, you need to configure Magento to send logs to Loggly and New Relic. Finally, you need to verify the integration by checking if the logs are correctly sent and displayed in Loggly and New Relic.
Can I use Loggly and New Relic for other applications apart from Magento?
Yes, Loggly and New Relic are versatile tools that can be used with a wide range of applications. They provide comprehensive application performance management and log management solutions, making them suitable for various applications, including web applications, mobile applications, and microservices.
What are the benefits of using New Relic’s APM for Magento?
New Relic’s APM provides real-time performance insights into your Magento application. It helps in identifying slow transactions, detecting errors, and analyzing the performance of individual components. This allows you to optimize your application’s performance, improve its reliability, and enhance the user experience.
How does Loggly help in log management for Magento?
Loggly provides a centralized platform for log management. It collects, aggregates, and analyzes logs from your Magento application, providing you with valuable insights into its performance and operation. It helps in identifying issues, troubleshooting them, and optimizing your application’s performance.
What are the prerequisites for integrating Loggly and New Relic with Magento?
Before integrating Loggly and New Relic with Magento, you need to have a running Magento application, a Loggly account, and a New Relic account. You also need to install and configure the New Relic APM agent on your server.
How can I troubleshoot issues with the integration of Loggly and New Relic with Magento?
If you encounter any issues with the integration, you can check the logs in Loggly and New Relic for any error messages or anomalies. You can also refer to the documentation of Loggly and New Relic for troubleshooting guides.
Can I integrate Loggly and New Relic with Magento 2?
Yes, you can integrate Loggly and New Relic with Magento 2. The integration process is similar to that of Magento 1, but you need to ensure that your Magento 2 application is compatible with the versions of Loggly and New Relic you are using.
What are the alternatives to Loggly and New Relic for APM and log management?
There are several alternatives to Loggly and New Relic for APM and log management, including Datadog, Splunk, and Elastic Stack. These tools also provide comprehensive solutions for monitoring, analyzing, and optimizing application performance. However, the choice of tool depends on your specific requirements and preferences.
 Jacco Blankenspoor
Jacco Blankenspoor is a website developer from the Netherlands, and is currently just building lots of different websites. When he is not working on HIPAAHQ.com you might catch him grinding coffee.