Let’s build a real-time service dashboard!
Our service dashboard will show us real data in real time. It will show us what’s happening on our server and our micro service in near real time, asynchronous, non-blocking fashion.
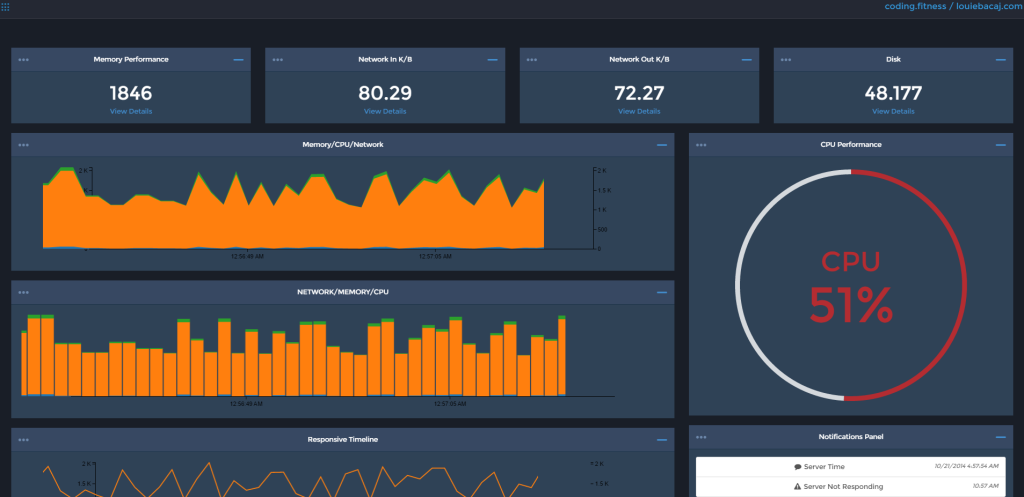
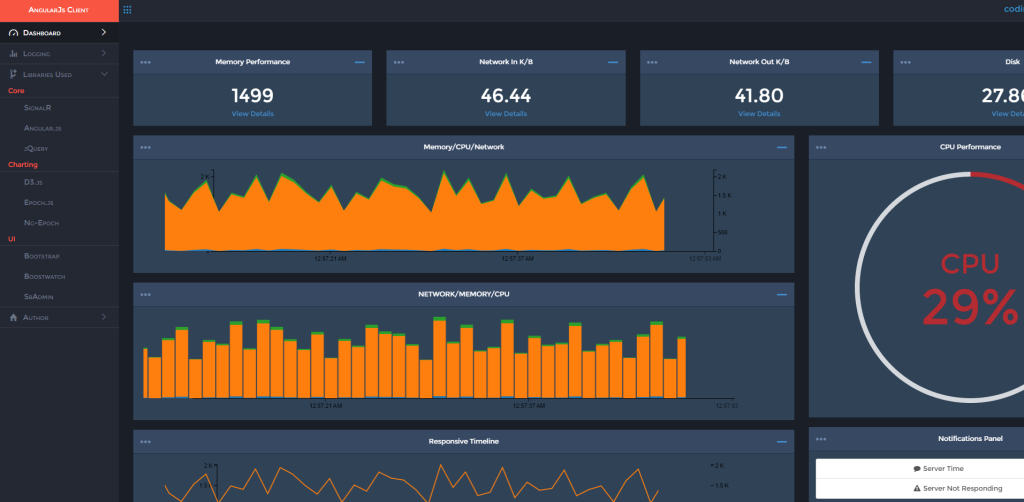
Take a look at what a full client can look like here.
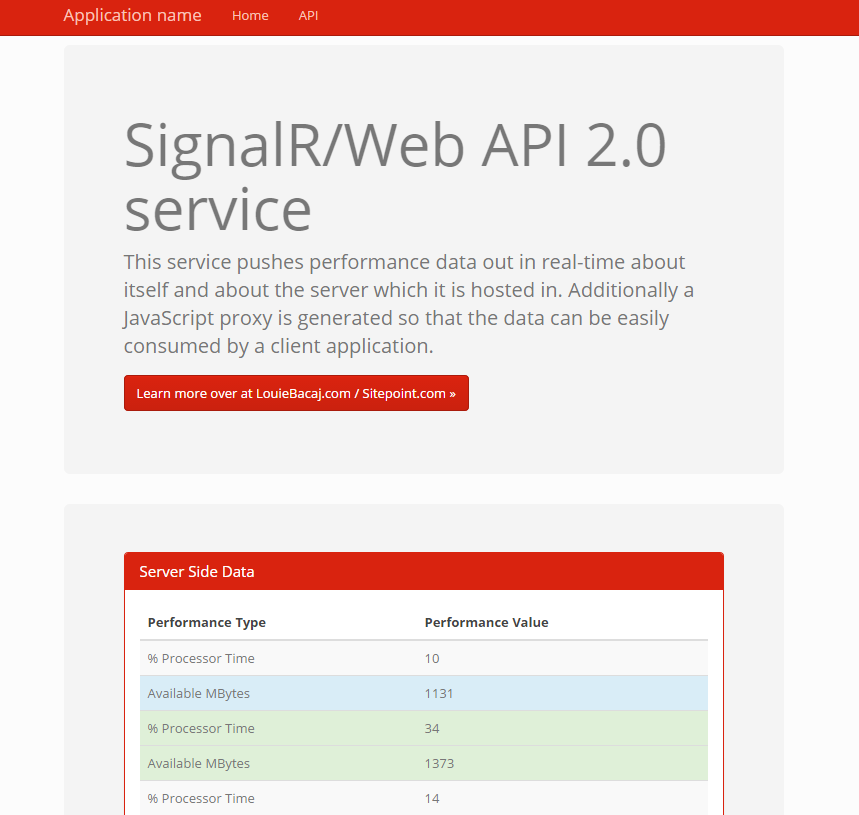
A demo of the server can be seen here.
We’ll build a smaller version of this dashboard using the AngularJS framework and lots of cool real time charts with lots of real time data. We’ll also build our service using the SignalR and Web API libraries from .NET 4.5.
Technology Architecture
The Client
AngularJS forces great application development practices right out of the box. Everything is injected in, which means there is low coupling of dependencies. Additionally, Angular has a great separation between views, models and controllers.
Angular compliments .NET here by allowing the server side code to remain small, manageable and testable. The server side code is leveraged solely for its strengths – which is to do the heavy lifting.
The Server
Using SignalR with Web API for .NET 4.5 is very similar to using Node.js with Socket.IO, and allows for the same type of non-blocking, asynchronous push from the server to subscribing clients. SignalR uses web sockets underneath, but because it abstracts away the communication, it will fall back to whatever technology the client browser supports when running inside Angular. (For example, it may fall back to long polling for older browsers.)
Additionally, with the dynamic tag and the magic of Json.NET, JavaScript is treated like a first class citizen by the .NET framework. In fact, it is often easier to consume Web API and SignalR technologies in JavaScript than even through native .NET clients, because they were built with JavaScript in mind.
The Meat and Potatoes
Get Setup
All of the AngularJS code used in this tutorial can be found here.
I will go over creating this with your favorite text editor and plain folders, as well as with Visual Studio for those creating a project.
Setup with Plain Text Files
The folder and file structure will look like this:
root
    app     (Angular application specific JavaScript)
    Content (CSS etc.)
    Scripts (Referenced JavaScript etc.)
    ...
    index.html
Main Dependencies
You will need to download the following files:
- jQuery (choose the “Download the compressed, production jQuery 2.1.1” link)
- AngularJS (click on the large Download option, then click the latest version of Angular 1.3.+)
- Bootstrap (click the “Download Bootstrap” option)
- SignalR (click the “Download ZIP” button on the right)
- D3.js (click the “d3.zip” link half way down the page)
- Epoch (click the “Download v0.6.0 link)
- ng-epoch (click the “Download ZIP” button on the right)
- n3-pie (click the “Download ZIP” button on the right)
In our Scripts folder we will need:
jquery-2.1.1.min.jsangular.min.jsbootstrap.min.jsjquery.signalR.min.jsd3.min.jsepoch.min.jspie-chart.min.js
In our Content folder:
bootstrap.min.cssepoch.min.css
Setup with Visual Studio
Setting this up through Visual Studio is extremely simple, if text files are too simplistic for you.
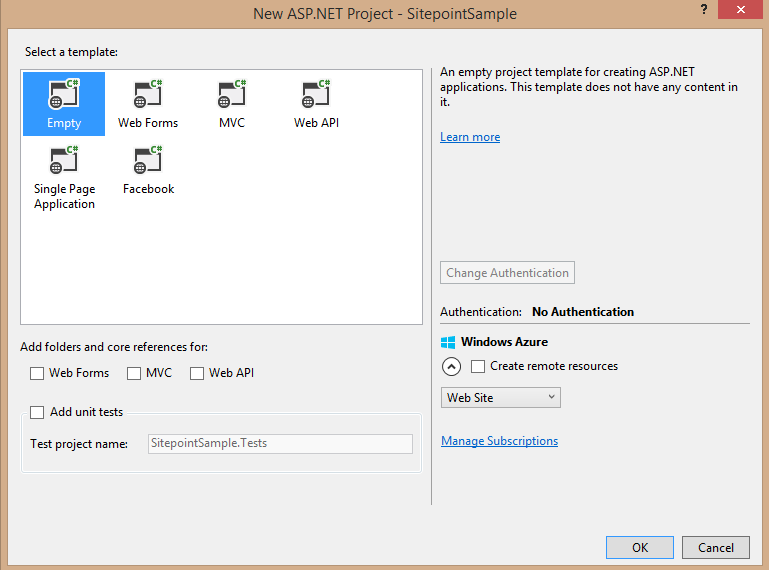
Simply set up an empty web application by going to File -> New -> Project, then select Web as the template type.
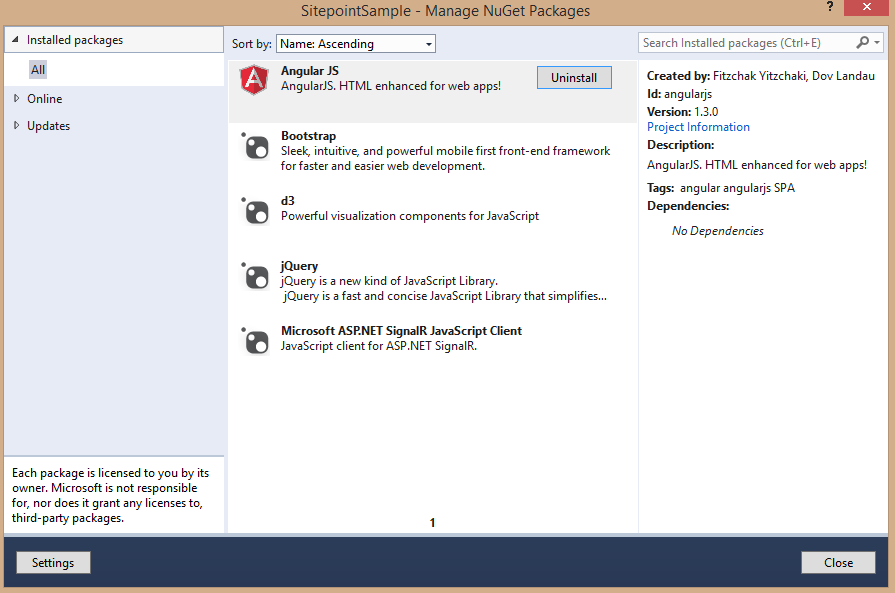
Then simply right click on the project, go to Manage Nuget Packages and search for and download jQuery, AngularJS, Bootstrap, D3 and the SignalR JavaScript Client.
After you download and install those, you should see them all in the Scripts and the Contents folders. Additionally, under installed Nuget Packages, you will see the following:
Finally, Nuget does not contain the Epoch, ng-epoch and n3 charting libraries, so you’ll need to add them manually. Simply follow the steps detailed in the previous section to get these.
Let’s Write Our App
Now we are ready to write some code.
First, let’s create our base index.html file that will house our Angular JavaScript code.
<!DOCTYPE html>
<html xmlns="https://www.w3.org/1999/xhtml">
<head>
  <meta charset="utf-8">
  <meta http-equiv="X-UA-Compatible" content="IE=edge">
  <meta name="viewport" content="width=device-width, initial-scale=1">
  <title>AngularJS - SignalR - ServiceDashboard</title>
  <link rel="stylesheet" href="Content/bootstrap.min.css" />
  <link rel="stylesheet" href="Content/epoch.min.css" />

  <script src="Scripts/jquery-1.11.0.js"></script>
  <script src="Scripts/bootstrap.min.js"></script>
  <script src="Scripts/jquery.signalR-2.1.2.min.js"></script>
  <script src="Scripts/angular.min.js"></script>

  <script src="Scripts/d3.min.js"></script>
  <script src="Scripts/epoch.min.js"></script>
  <script src="Scripts/ng-epoch.js"></script>
  <script src="Scripts/pie-chart.min.js"></script>

  <script src="app/app.js"></script>
  <script src="app/services.js"></script>
  <script src="app/directives.js"></script>
  <script src="app/controllers.js"></script>

</head>
  <body ng-app="angularServiceDashboard">
  </body>
</html>
There are a few things going on here. We are, first and foremost, adding all of our dependencies so they load up. Secondly, we are referencing a few new files (all of the files in the app folder) that do not exist yet. We will write those next.
Let’s go into our app folder and create our app.js file. This is a very simple file.
'use strict';

var app = angular.module('angularServiceDashboard', ['ng.epoch','n3-pie-chart']);
app.value('backendServerUrl', 'http://sitepointsignal.cloudapp.net/');
This file does a few things for us. It sets up our main application module angularServiceDashboard and injects in two of our external references – ng.epoch, which is our Epoch.js Directive for Angular, and the n3-pie-chart, which is a charting library made for Angular and is properly structured.
If you notice, we also inject in a value for the backendServerUrl, which of course is hosted somewhere else and which we plan to consume here.
Let’s create a service factory class that will bind to the URL of the server. This will be our services.js file we referenced in our HTML, and it will go into the app folder:
'use strict';

app.factory('backendHubProxy', ['$rootScope', 'backendServerUrl',
  function ($rootScope, backendServerUrl) {

    function backendFactory(serverUrl, hubName) {
      var connection = $.hubConnection(backendServerUrl);
      var proxy = connection.createHubProxy(hubName);

      connection.start().done(function () { });

      return {
        on: function (eventName, callback) {
              proxy.on(eventName, function (result) {
                $rootScope.$apply(function () {
                  if (callback) {
                    callback(result);
                  }
                 });
               });
             },
        invoke: function (methodName, callback) {
                  proxy.invoke(methodName)
                  .done(function (result) {
                    $rootScope.$apply(function () {
                      if (callback) {
                        callback(result);
                      }
                    });
                  });
                }
      };
    };

    return backendFactory;
}]);
This bit of code uses the popular on and off (with no off since we don’t need it here) subscription pattern, and encapsulates all of the communication with SignalR for our app by using an Angular factory.
This code may seem a bit overwhelming at first, but you will understand it better when we build our controllers. All it does is take in the URL of our back-end SignalR server and the SignalR hub name. (In SignalR you can use multiple hubs in the same server to push data.)
Additionally, this code allows the SignalR Server, which is sitting on another box somewhere, to call our app through the on method. It allows our app to call functions inside of the SignalR Server through the invoke method.
Next up, we need our controllers, which will bind our data from the service to our scope. Let’s create a file called controllers.js in our app folder.
'use strict';

app.controller('PerformanceDataController', ['$scope', 'backendHubProxy',
  function ($scope, backendHubProxy) {
    console.log('trying to connect to service')
    var performanceDataHub = backendHubProxy(backendHubProxy.defaultServer, 'performanceHub');
    console.log('connected to service')
    $scope.currentRamNumber = 68;

    performanceDataHub.on('broadcastPerformance', function (data) {
      data.forEach(function (dataItem) {
        switch(dataItem.categoryName) {
          case 'Processor':
            break;
          case 'Memory':
            $scope.currentRamNumber = dataItem.value;
            break;
          case 'Network In':
            break;
          case 'Network Out':
            break;
          case 'Disk Read Bytes/Sec':
            break;
          case 'Disk Write Bytes/Sec':
            break;
          default:
            //default code block
            break;
        }
      });
    });
  }
]);
This controller does a few things here. It creates our Angular Service object and binds a callback function to it, so that the server has something to call in our controller.
You will see that we are looping through the JSON array returned by the server each time it calls us back. We then have a switch statement for each performance type. For now, we will set the RAM and come back and flesh out the rest.
As far as our directives are concerned, we really only need one for our Epoch charts. We’ll use an open-source directive called ng-epoch.js, which we already have a reference for in our stub index.html file.
We could split all of these charts into different directives, use some templates and use UI-Router, but we’ll keep things simple here and dump all our views in our index.html file.
Let’s add our views to the index.html file now. We can do this by adding the following under the body tags:
<div class="row" ng-controller="PerformanceDataController">
<div class="col-lg-3 col-md-6">
<div class="panel panel-dashboard">
<div class="center">Memory Performance</div>
<div class="panel-body">
<div class="huge">{{currentRamNumber}}</div>
<div class="clearfix"></div>
</div>
</div>
</div>
</div>
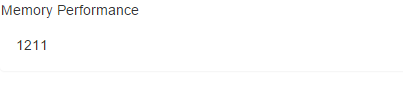
</div>This will simply create a place for the server to push back the RAM data. Data will first go to our service, then to the controller and then finally to the view.
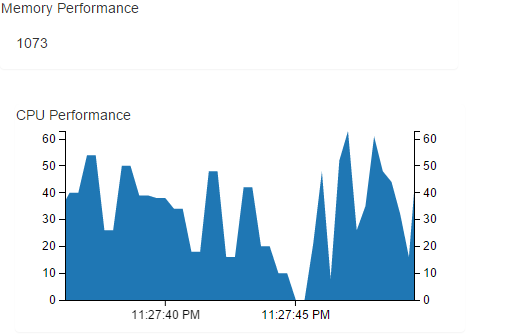
It should look something like this:
Now let’s add some charting, which is what we really want to do. We will add a variable called timestamp for the epoch.js timeline. We’ll also add an array called chartEntry, which we’ll bind to our epoch.ng directive.
var timestamp = ((new Date()).getTime() / 1000) | 0;
var chartEntry = [];
Then let’s map the data in our switch statement and add the rest of the required epoch.js data items. We could, of course, break this out further (such as use some more functions and filters), but we’ll keep things simple for the sake of the tutorial.
'use strict';

app.controller('PerformanceDataController', ['$scope', 'backendHubProxy',
  function ($scope, backendHubProxy) {
    ...

    $scope.currentRamNumber = 68;
    $scope.realtimeArea = [{ label: 'Layer 1', values: [] }];

    performanceDataHub.on('broadcastPerformance', function (data) {
      var timestamp = ((new Date()).getTime() / 1000) | 0;
      var chartEntry = [];

        data.forEach(function (dataItem) {
          switch(dataItem.categoryName) {
            case 'Processor':
              $scope.cpuData = dataItem.value;
              chartEntry.push({ time: timestamp, y: dataItem.value });
              console.log(chartEntry)
              break;
            case 'Memory':
              $scope.currentRamNumber = dataItem.value;
              break;
            case 'Network In':
              break;
            case 'Network Out':
              break;
            case 'Disk Read Bytes/Sec':
              break;
            case 'Disk Write Bytes/Sec':
              break;
            default:
              //default code block
              break;
          }
        });
        $scope.realtimeAreaFeed = chartEntry;
      });
      $scope.areaAxes = ['left','right','bottom'];
  }
]);
Our controller looks a bit more fleshed out. We have added a realtimeAreaFeed to the scope, which we’ll bind to our view via the ng-epoch directive, and we have also added the areaAxes to the scope, which dictates the layout of the area chart.
Now let’s add the directive to index.html and display the data coming in for CPU values:
<div class="row" ng-controller="PerformanceDataController">
  <div class="panel-body" ng-controller="PerformanceDataController">

    <epoch-live-area chart-class="category10"
                     chart-height="200"
                     chart-data="realtimeArea"
                     chart-stream="realtimeAreaFeed"
                     chart-axes="areaAxes">
    </epoch-live-area>
  </div>
</div>
chart-class refers to the coloring scheme of D3.js, chart-height is what you suspect, and chart-stream is the data coming back from the SignalR server.
With that in place, we should see the chart come across in real time:
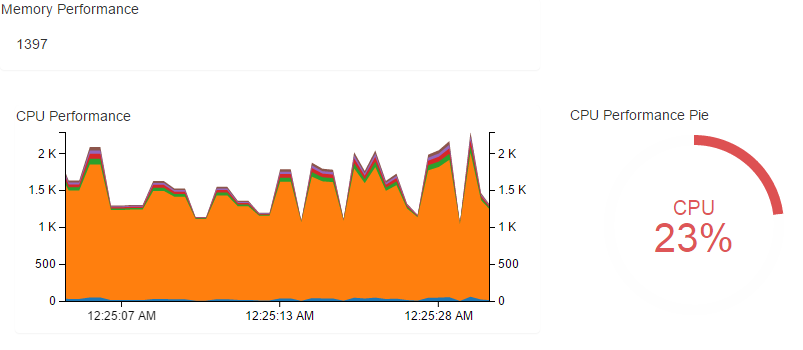
Let’s now wire up a whole bunch of data points to this chart, and add a whole other chart from the n3-pie framework (because who doesn’t love pie!).
To add the pie chart from the n3-pie framework, simply add the following to our controller:
$scope.data = [
  { label: 'CPU', value: 78, color: '#d62728', suffix: '%' }
];
The value, of course, will be updated by the SignalR server. You can see this in the full code for our controller.
We should also take a moment to consider the full code for our view.
And we should be seeing the following data on screen:
We have seen that Angular can wire up to SignalR extremely easily – by simply plugging in the end point in an AngularJS service or factory. The AngularJS factory is an encapsulation mechanism to communicate with SignalR. Who knew that AngularJS and .NET would work so well together when “married up”?
Core Aspects of the Server
I will go over a bit of the .NET code that allows this communication to happen on the back end. (You can find the source code here.)
To get started with building the server code first, you need to get SignalR running in your Visual Studio solution. To do this, simply follow the great tutorials over at ASP.NET to get the base SignalR solution running. (This is the simplest one.)
Once you have that up and running, change the C# Hub class to the following:
public class PerformanceHub : Hub
{
  public void SendPerformance(IList<PerformanceModel> performanceModels)
  {
    Clients.All.broadcastPerformance(performanceModels);
  }

  public void Heartbeat()
  {
    Clients.All.heartbeat();
  }

  public override Task OnConnected()
  {
    return (base.OnConnected());
  }
}
Once you change the Hub class, Visual Studio will complain and you will need to add a performance model (this is automatically converted to JSON as it’s pushed out by the server, thanks to Json.NET):
using System;
using System.Collections.Generic;
using System.Linq;
using System.Web;
using Newtonsoft.Json;

namespace SignalrWebService.Models
{
  public class PerformanceModel
  {
    [JsonProperty("machineName")]
    public string MachineName { get; set; }

    [JsonProperty("categoryName")]
    public string CategoryName { get; set; }

    [JsonProperty("counterName")]
    public string CounterName { get; set; }

    [JsonProperty("instanceName")]
    public string InstanceName { get; set; }

    [JsonProperty("value")]
    public double Value { get; set; }
  }
}
The JsonProperty metadata is simply telling Json.NET to automatically convert the property name to lower case when converting to JSON for this model. JavaScript likes lower case.
Let’s add a PerformanceEngine class, which pushes to anyone that will listen with real performance data. The engine sends these messages via SignalR to any listening clients on an asynchronous background thread.
Due to it’s length, you can find the code on our GitHub repo.
This code basically pushes an array of performance metrics out to anyone that is subscribed in each while iteration. Those performance metrics are injected into the constructor. The speed of the push from the server is set on the constructor parameter pollIntervalMillis.
Note that this will work fine if you’re hosting SignalR using OWIN as a self host, and it should work fine if you’re using a web worker.
The last thing to do, of course, is to start the background thread somewhere in your service OnStart() or in your Startup class.
using System;
using System.Collections.Generic;
using System.Linq;
using System.Web;
using Owin;
using System.Threading.Tasks;
using Microsoft.Owin;
using SignalrWebService.Performance;
using Microsoft.Owin.Cors;
using Microsoft.AspNet.SignalR;
using SignalrWebService.Models;

[assembly: OwinStartup(typeof(SignalrWebService.Startup))]

namespace SignalrWebService
{
  public class Startup
  {
    public void Configuration(IAppBuilder app)
    {
      app.UseCors(CorsOptions.AllowAll);
      var hubConfiguration = new HubConfiguration();
      hubConfiguration.EnableDetailedErrors = true;
      app.MapSignalR(hubConfiguration);


      PerformanceEngine performanceEngine = new PerformanceEngine(800, GetRequiredPerformanceMonitors());
      Task.Factory.StartNew(async () => await performanceEngine.OnPerformanceMonitor());
    }
  }
}
The two lines that start the monitoring on the background thread (as I’m sure you’ve guessed) are those where we instantiate the PerformanceEngine and where we call the OnPerformanceMonitor().
Now, I know you might be thinking that I’m randomizing the data from the server, and it’s true. But to push real metrics, simply use the System.Diagnostics library and the PerformanceCounter provided by Windows. I am trying to keep this simple, but here is what that code would look like:
public static readonly IEnumerable<PerformanceCounter> ServiceCounters = new[]
{
  //http://weblogs.thinktecture.com/ingo/2004/06/getting-the-current-process-your-own-cpu-usage.html
  new PerformanceCounter("Processor Information", "% Processor Time", "_Total"),
  new PerformanceCounter("Memory", "Available MBytes"),
  new PerformanceCounter("Process", "% Processor Time", GetCurrentProcessInstanceName(), true),
  new PerformanceCounter("Process", "Working Set", GetCurrentProcessInstanceName(), true)
};
Conclusion
We’ve seen how to consume SignalR data through Angular, and we’ve hooked that data up to real time charting frameworks on the Angular side.
A demo of the final version of the client can be seen here, and you can get the code from here.
A demo of the final version of the server can be seen here, and you can get the code from here.
I hope you’ve enjoyed this walk-through. If you’ve tried something similar, tell us about it in the comments!
Frequently Asked Questions (FAQs) on Building a Real-Time SignalR Dashboard with AngularJS
How do I set up SignalR in AngularJS?
Setting up SignalR in AngularJS involves a few steps. First, you need to install the SignalR library using NuGet or npm. Once installed, you can create a new SignalR hub on your server. This hub will be responsible for sending and receiving messages. On the client side, you need to reference the SignalR JavaScript library and create a connection to your hub. You can then start the connection and define functions to handle incoming messages.
How can I handle connection errors in SignalR?
SignalR provides a built-in mechanism for handling connection errors. You can use the .error() function on your hub connection to define a callback that will be invoked when an error occurs. This callback can display an error message to the user or attempt to reconnect to the hub.
Can I use SignalR with other JavaScript frameworks?
Yes, SignalR can be used with any JavaScript framework that supports AJAX and WebSockets. This includes popular frameworks like React, Vue.js, and Angular. You just need to include the SignalR JavaScript library in your project and create a hub connection as you would in any other JavaScript application.
How do I send messages from the server to the client with SignalR?
To send messages from the server to the client, you can use the Clients property of your hub. This property provides methods for sending messages to all connected clients, to specific clients, or to groups of clients. You can call these methods from any part of your server code to send real-time updates to your clients.
How can I secure my SignalR application?
SignalR provides several options for securing your application. You can use the [Authorize] attribute to restrict access to your hubs and hub methods. You can also use the MapHubs() method in your Global.asax file to specify a custom authorizer for your hubs. Additionally, you can use SSL to encrypt your SignalR traffic and protect it from eavesdropping.
How do I handle disconnections in SignalR?
SignalR automatically handles disconnections and attempts to reconnect. However, you can also handle disconnections manually by using the .disconnected() function on your hub connection. This function allows you to define a callback that will be invoked when the connection is lost.
Can I use SignalR with a non-.NET server?
SignalR is a .NET library and is designed to work with .NET servers. However, it’s possible to use SignalR with a non-.NET server by using a compatible WebSocket library. You would need to implement the SignalR protocol on your server and handle the connection and messaging logic yourself.
How do I test my SignalR application?
You can test your SignalR application by using a tool like Postman or Fiddler to send HTTP requests to your hub and verify the responses. You can also write unit tests for your hub methods and client functions.
Can I use SignalR in a mobile application?
Yes, you can use SignalR in a mobile application. The SignalR JavaScript library can be used in a hybrid mobile application built with Cordova or Ionic. For native mobile applications, there are SignalR clients available for both iOS and Android.
How do I scale my SignalR application?
SignalR provides several options for scaling out your application. You can use the Azure SignalR Service, which is a fully-managed service that handles all the SignalR connections for you. You can also use a backplane, which is a software layer that distributes messages across multiple servers.
 Louie Bacaj
Louie Bacaj is a Senior Software Engineer with an M.S. in computer science; experienced scaling multi-million dollar software projects to several tier 1 financial institutions. Passionate about technology, fitness, and an active blogger over at http://coding.fitness