
Keep up to date on current trends and technologies
Blog
Beyond the Model: Building Real World Machine Learning
Craig Hardy

Optimizing Arm-based Build Servers
Dave Neary
GPT-5.6 Sol: What OpenAI's New Flagship Model Means for Developer Workflows
SitePoint Team

Why business transaction monitoring matters for web app performance
SitePoint Sponsors

Configuring secure, sovereign AIOps for IT teams in regulated sectors with OpManager and Ollama
SitePoint Sponsors

Designing Human-in-the-Loop AI Systems for Commerce Operations
Anwesha Roy
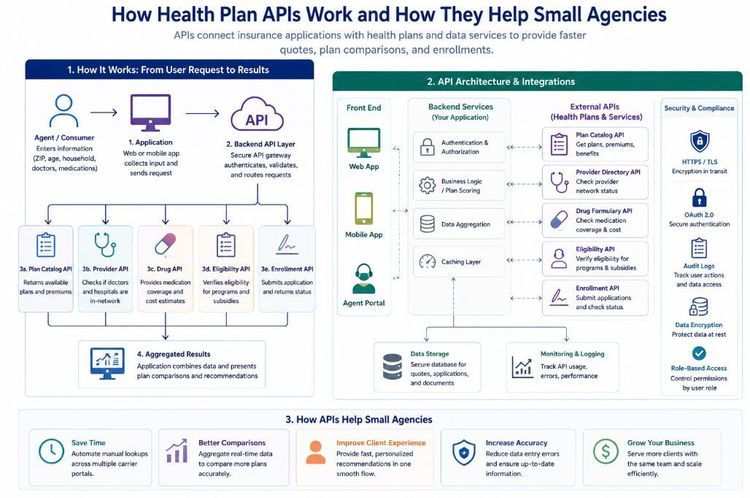
Building Smarter Insurance Applications: How Health Plan APIs Can Empower Small Agencies
Shilei Zhang
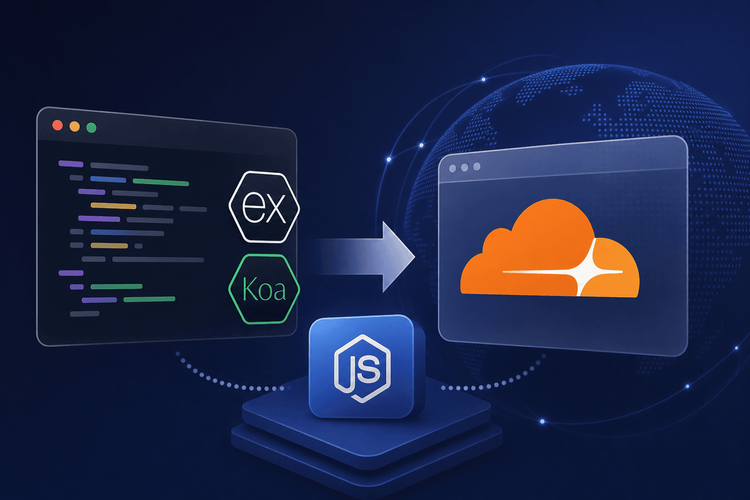
Migrating Express and Koa Apps to Cloudflare Workers: Node.js Compatibility Production Guide
SitePoint Team
Vite 7 Production Migration: From esbuild to Rolldown and Oxc
SitePoint Team
Testing React Server Components: Vitest Patterns for Async Boundaries and Mock Strategies
SitePoint Team

CSS Container Queries and Subgrid: Building Context-Aware Component Layouts
SitePoint Team
TypeScript 5.8 Production Migration: Adopting Erasable Syntax for Node.js 23+
SitePoint Team
TanStack Router v1: Migrating from React Router to Type-Safe File-Based Routing
SitePoint Team
Vite 8 Migration: Moving from esbuild to Oxc in Production React Apps
SitePoint Team
Optimizing Cost per Insight in AI Data Analytics Systems
SitePoint Team

Local AI Coding vs Cloud: Performance Analysis 2026
SitePoint Team

AI Agent Testing Automation: Developer Workflows for 2026
SitePoint Team

Best Ethereum Payment Gateways 2026
NOWPayments

How AI Assistants Improve Remote Team Communication for Developers
SitePoint Team
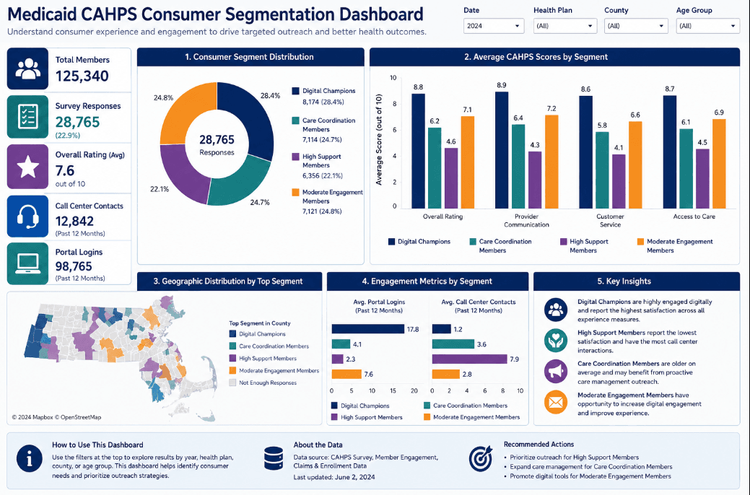
From Survey Responses to Consumer Insights: Building a Medicaid Consumer Segmentation Pipeline with Python, K-Means, and Tableau
Shilei Zhang
Claude Sonnet 5 Pricing: What the Cost Parity Misses
SitePoint Team
Alibaba Bans Claude Code: The Backdoor Scare Explained
Matt Mickiewicz
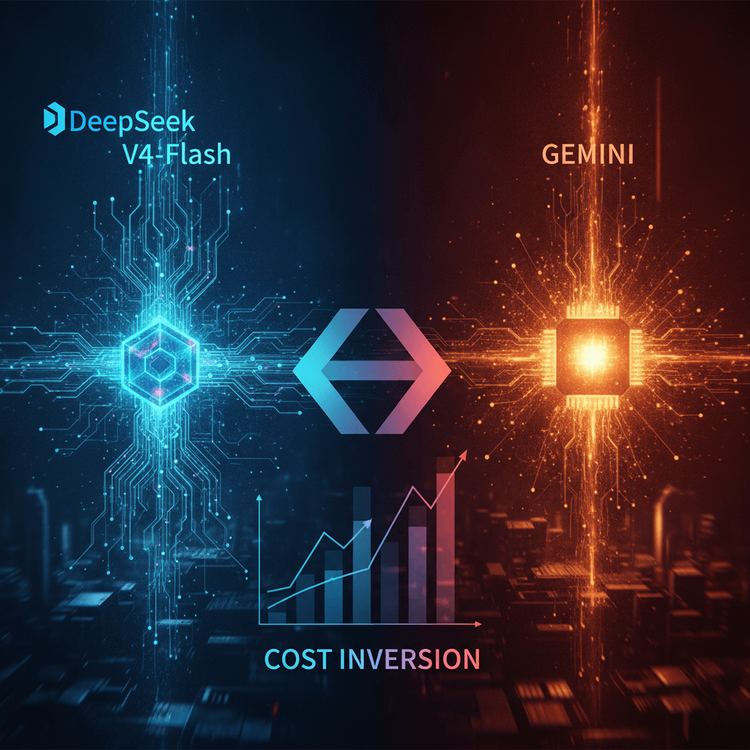
The Cost Inversion: Running Production AI on DeepSeek V4-Flash vs Gemini
Matt Mickiewicz
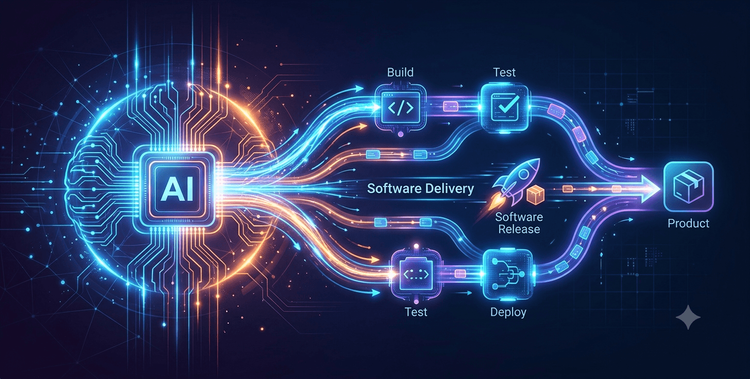
Beyond Code Generation: How AI Is Reshaping Modern Software Delivery
A Smith
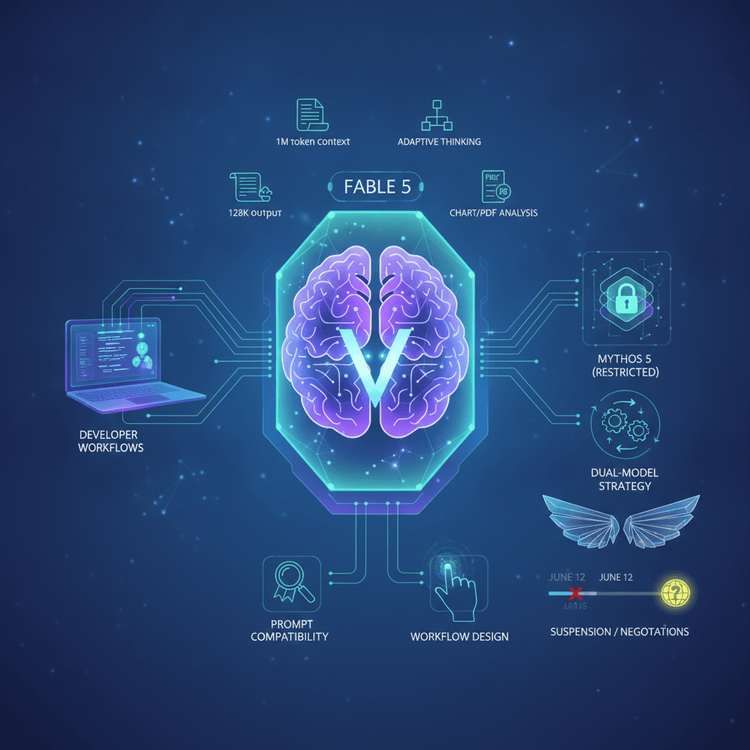
Claude Fable 5: What the Mythos-Class Model Means for Developer AI Workflows
SitePoint Team
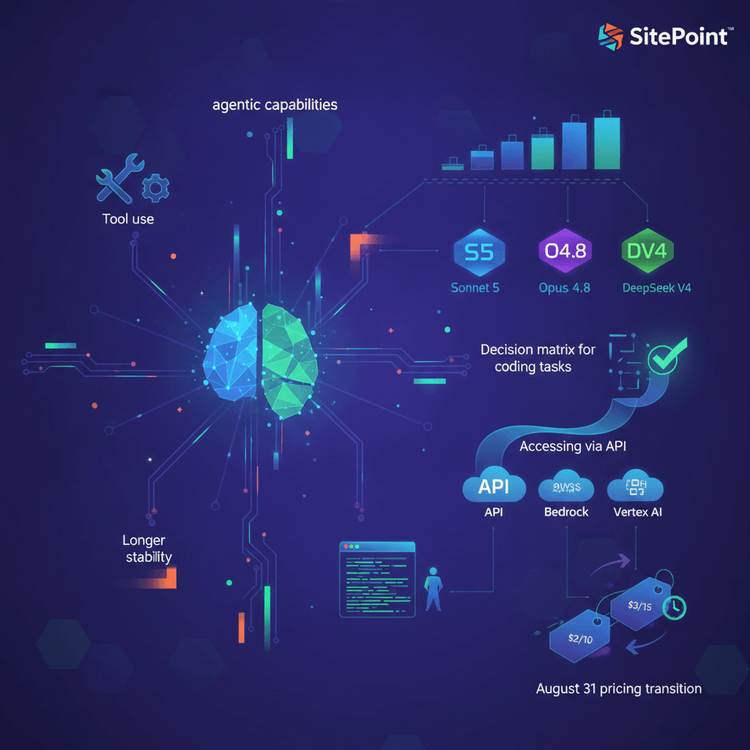
Claude Sonnet 5: The Developer’s Guide to Anthropic’s New Default Model
SitePoint Team
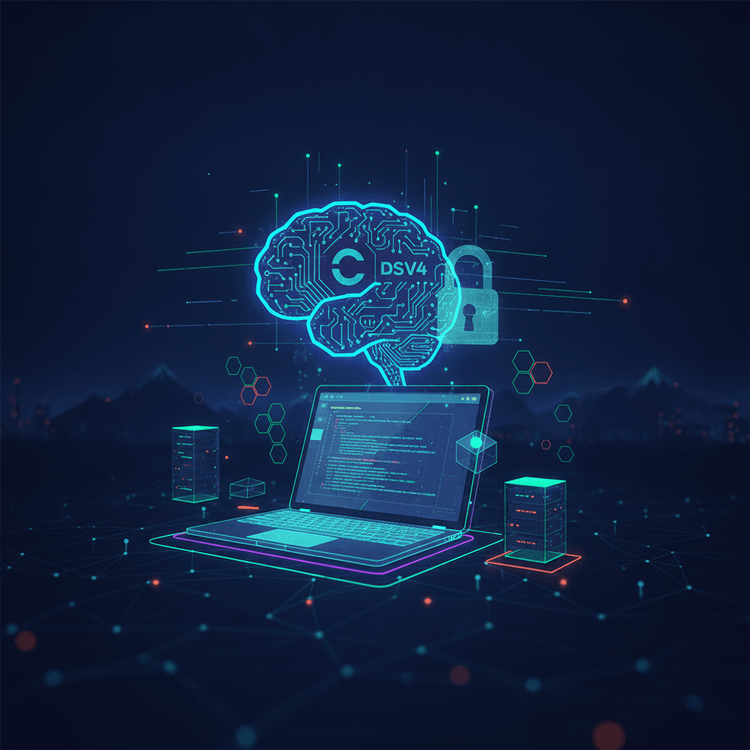
OpenClaude with DeepSeek V4: Running a Fully Private AI Coding Engine on Your Laptop
Matt Mickiewicz

HALO: Debug AI Agent Traces Locally Without a Cloud Subscription
SitePoint Team

OpenTelemetry GenAI: Instrument AI Agents Without Sending Data to the Cloud
SitePoint Team
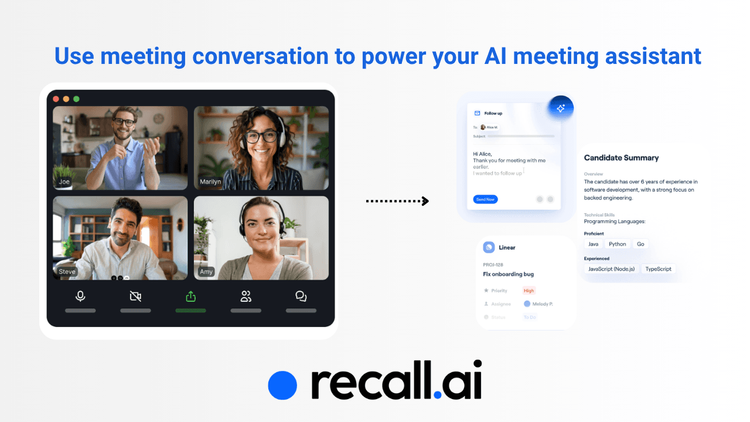
How to build a production-ready AI meeting assistant with Recall.ai in 48 hours
SitePoint Sponsors
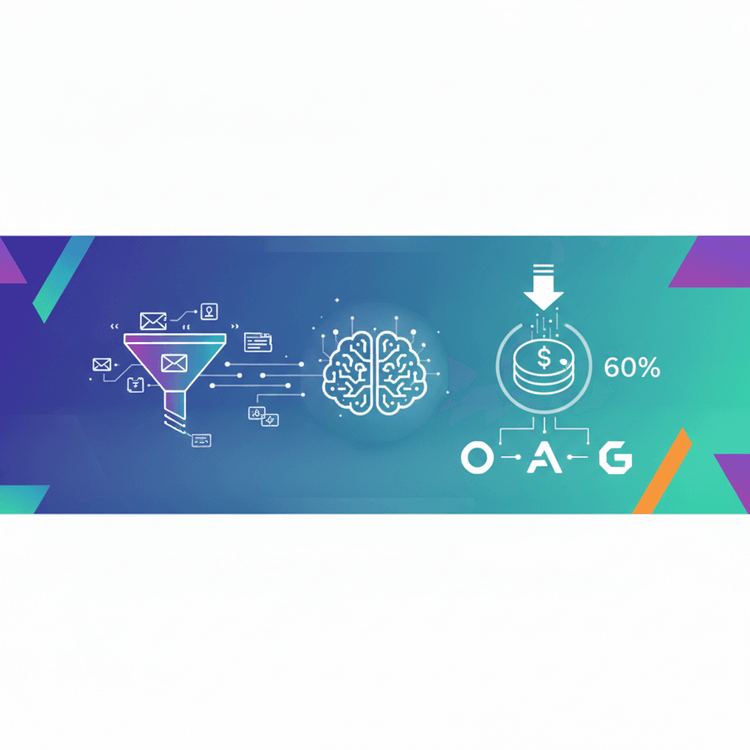
Prompt Compression and Cache Tuning: Cut Your LLM API Costs by 60%
SitePoint Team
Claude Code on Ollama: How to Run a Local Coding Agent Without Burning API Credits
SitePoint Team
Showing 32 of 8468