
D3.js is a powerful data visualization library that allows you to create amazing charts — such as bubble charts, line and bar charts — with just a few lines of code.
With a beginner’s understanding of JavaScript, you can convert your array or object into a colorful display. However, every single beginner struggles at first to understand how data is tied to actual elements in the DOM. This is known as “data binding” or “data joins”. It’s a huge deal, because it’s the first step of the entire process!
Intuitively, you might expect a for() loop, where you loop over every item in your data and create an element. Like this:
var data = [{x: 100, y: 100}, {x: 200, y: 200}, {x: 300, y: 300}]

for(var i=0; i< data.length; i++){
    svg.append("circle")
        .attr("cx", function(data) { return data[i].x; })
        .attr("cy", function(data) { return data[i].y; })
        .attr("r", 2.5);
}
But this isn’t how it works! In fact, there are no for() loops involved at all. Instead, here’s the code block that would cover the functionality above:
var data = [{x: 100, y: 100}, {x: 200, y: 200}, {x: 300, y: 300}]

svg.selectAll("circle")
    .data(data)
    .enter().append("circle")
    .attr("cx", function(d) { return d.x; })
    .attr("cy", function(d) { return d.y; })
    .attr("r", 2.5);
This would add 3 black circles to your SVG canvas. Whoa. This is because D3 uses a declarative style of programming. The for() loop is covered implicitly in this code block.
This takes some getting used to, so I’m going to go through the code block above line-by-line so you can understand exactly what’s going on. It’s the same idea as planting a vegetable garden. When you’re done reading, you’ll be able to build any basic visualization in 5 to 10 lines and get started with styling (the easy part).
If you’re looking for a more technical explanation of this concept, check out the D3 documentation or Scott Murray’s guide to data binding.
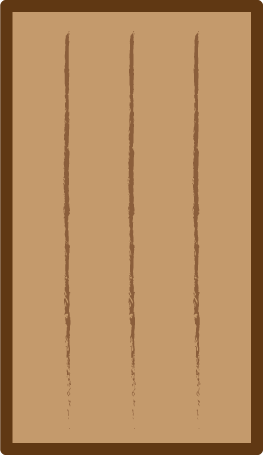
Step 1: SVG/ The Plot of Land
First, you need to choose where you want to draw the data visualization. This is equivalent to choosing the area you want to plant:
>var svg = d3.select("body")
    .append("svg")
    .attr("width", '800px')
    .attr("height", '800px');
This creates an 800px by 800px area of land — the body — into which you can add your elements. Pretty straightforward.
Step 2: selectAll/ Creating the Holes
Next, we need a selectAll() statement to create the group that we’ll later fill with elements. Think of this like digging the holes in your garden. D3 does this so that you can later either update or remove the entire set of elements at once. Here’s an example:
svg.selectAll("circle")If you haven’t previously added any circles, this will work just fine. Please note that “circle” is a basic shape from the SVG specification. If you’ve previously added circles, you can just use a class here, like:
svg.selectAll(".circleClass")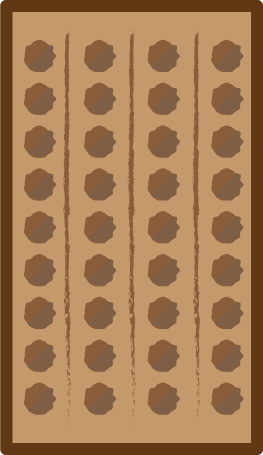
Okay, this image is slightly misleading. There’s an infinite number of holes within the part of the garden you plan on planting. There wasn’t a great way to turn that into an image in a reasonable amount of space. The important part is that you are delineating a certain area in which you’ll be planting data elements. If you wanted to add SVG “rect” elements, you’d do that in a different part of the garden. At this point in the code, it’s unclear how many elements you’ll actually add. Let’s figure that out!
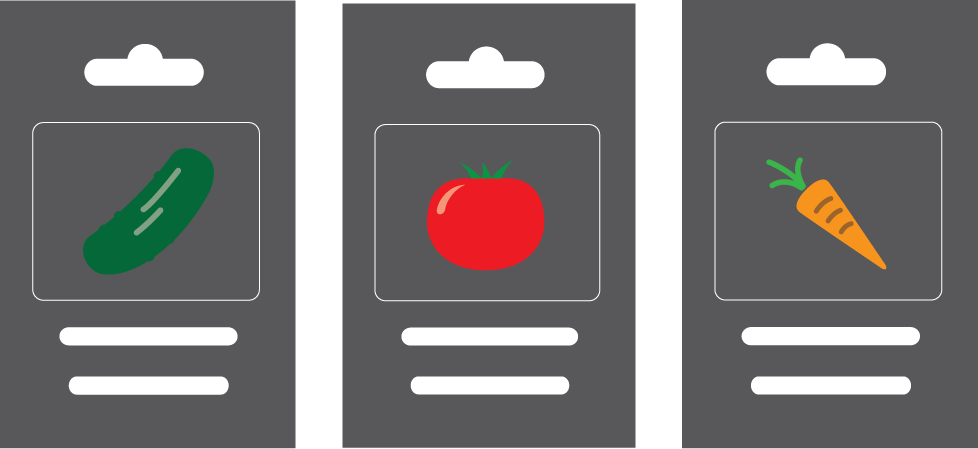
Step 3: Data/ The seeds
This is the most important part. It determines what data will be used in the visualization. In JavaScript, you can pass this data in the form of an array or object. In this step, you “bind” your data to the type of DOM element you specified in selectAll(). After this point, you can reference items in the array or object just like you always do in JavaScript. We’ll get to that in a couple of steps. In the case below, there are three items in the array, so we expect that three elements will be added to the DOM when we’re done:
var data = [{x: 100, y: 100}, {x: 200, y: 200}, {x: 300, y: 300}]

svg.selectAll("circle")
    .data(data)
This is the same as selecting a specific type of seed for the garden. Each type of seed has certain characteristics, and will blossom into a known type of plant.
Step 4: Enter/ Put Seeds in Holes
The .enter() command matches the selectAll statement with the number of elements in the array/object, and determines the number of elements that will need to be created. You no longer have an infinite plot of land! The number of holes in your plot of land now matches the number of plants you want to grow:
svg.selectAll("circle")
    .data(data)
    .enter()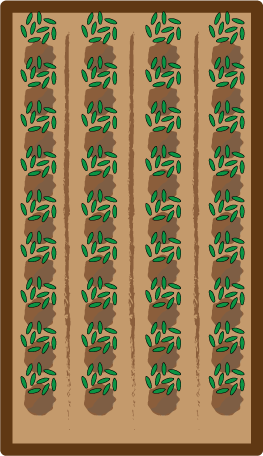
In the code for this example, there are now three holes, and seeds of one specific type in each of those holes (tomatoes, for example). This also determines the number of iterations your code will automatically go through (3, again).
Step 5: Append/ The Structure of Your Plants
The .append() command determines which of the SVG basic shapes you’ll use. Although you have many options for the selectAll() statement, there are only seven shapes to choose from in this step (or a “g”, but that’s more advanced). selectAll() names the group, append() names the actual shape:
svg.selectAll("circle")
.data(data)
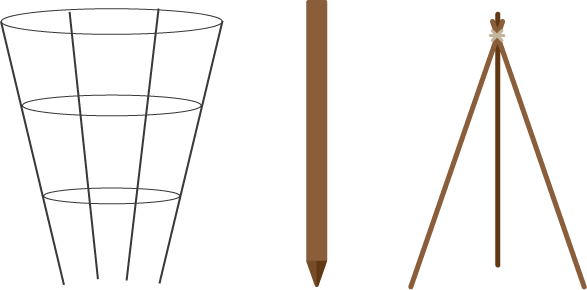
.enter().append("circle")This is similar to the structure that compliments your plant. What do you want your plant to grow into? If you want to grow tomatoes, you’ll need a tower. Different shapes and data visualizations are suited for different data sets.
Brief Explanation on How to Access the Data
Alright, now you’ve added three circle elements to the DOM. You chose your plot of land, dug the holes, planted the seeds and provided the structure for the plants to grow. Here’s how to choose the attributes of each circle:
.attr("cx", function(d) { return d.x; })
.attr("cy", function(d) { return d.y; })
From the circle specification, we know that you can determine a circle’s position within the SVG canvas with cx and cy. In both cases, we’re using function(d) to access the properties of each item in the original array. Since you used .enter(), you know this code block will run for each item in the array, a total of three times.
The d stands for each item in the array, like {x: 100, y: 100}. If it said d,i, the i would be index 0 for the first item, 1 for the second item and so on. And when you ask it to return d.x, you’re just looking at the x property of each item, and turning that into pixels. That would be 100 pixels right of the origin in this case. Now you’re just using normal JavaScript! You can use if statements, function calls and anything else.
Conclusion
Before you can build anything cool with D3, you need to understand its specific method for turning data into DOM elements of your choice. Styling is super easy compared to the data part. Adding text is very similar to adding shapes, so once you understand the data part, you understand text as well.
Although you may be cursing the D3 creators for adding such a challenging concept this early in the learning process, they had good reason to do it this way. D3 is a flexible library that can handle so many challenges nearly automatically. This data binding structure will allow you to complete complex actions in just one to two lines of code. Now go out and “wow” your users!
Editor’s note: there’s also an interactive version of this article.
Frequently Asked Questions (FAQs) about Data Binding in D3.js
What is the significance of data binding in D3.js?
Data binding is a crucial aspect of D3.js. It allows you to associate data with DOM (Document Object Model) elements and apply transformations to those elements. This process is fundamental to creating dynamic, interactive data visualizations. Without data binding, each element would need to be manually manipulated, which is not feasible for large datasets. Data binding automates this process, making it easier to manage and update visualizations as the underlying data changes.
How does the ‘enter’ method work in D3.js data binding?
The ‘enter’ method in D3.js is used when new data points are added to a dataset. It identifies any surplus data points that don’t have corresponding DOM elements and creates placeholders for them. These placeholders can then be used to generate new elements, ensuring that the visualization accurately reflects the updated dataset. This method is part of D3.js’s data join concept, which also includes the ‘update’ and ‘exit’ methods for handling existing and removed data points, respectively.
Can you explain the ‘exit’ method in D3.js data binding?
The ‘exit’ method in D3.js is used to handle data points that have been removed from a dataset. It identifies any DOM elements that no longer have corresponding data points and removes them from the visualization. This ensures that the visualization remains accurate even when data is removed. Like the ‘enter’ method, ‘exit’ is part of D3.js’s data join concept, which provides a systematic way to manage changes in data.
How can I bind data to DOM elements in D3.js?
Data can be bound to DOM elements in D3.js using the ‘data’ method. This method takes an array of data as input and associates each data point with a DOM element. If there are more data points than elements, the ‘enter’ method can be used to create new elements. If there are fewer data points, the ‘exit’ method can be used to remove surplus elements. This process ensures that the visualization accurately reflects the underlying data.
What is the role of the ‘update’ method in D3.js data binding?
The ‘update’ method in D3.js is used to handle changes to existing data points. It identifies any DOM elements that have corresponding data points and updates them to reflect the new data. This ensures that the visualization remains accurate even when data changes. The ‘update’ method is part of D3.js’s data join concept, which also includes the ‘enter’ and ‘exit’ methods for managing new and removed data points.
How can I use D3.js to create dynamic, interactive visualizations?
D3.js allows you to create dynamic, interactive visualizations by binding data to DOM elements and applying transformations to those elements. This process involves several steps, including selecting elements, binding data, entering new elements, updating existing elements, and exiting surplus elements. By manipulating elements in response to data changes, D3.js enables you to create visualizations that accurately reflect the underlying data and respond to user interactions.
Can you explain the concept of data join in D3.js?
Data join is a key concept in D3.js that involves associating data with DOM elements and managing changes to that data. It consists of three methods: ‘enter’, ‘update’, and ‘exit’. The ‘enter’ method is used when new data points are added, the ‘update’ method is used when existing data points change, and the ‘exit’ method is used when data points are removed. By systematically managing data changes, data join enables you to create dynamic, interactive visualizations.
What is the difference between D3.js and other data visualization libraries?
D3.js differs from other data visualization libraries in several ways. One of the main differences is its emphasis on data binding and transformations. Instead of providing pre-built charts, D3.js gives you the tools to create custom visualizations from scratch. This allows for greater flexibility and control, but also requires a deeper understanding of the underlying concepts. D3.js also uses web standards like SVG, HTML, and CSS, making it compatible with a wide range of platforms and devices.
How can I handle large datasets in D3.js?
D3.js is well-suited to handling large datasets thanks to its data binding and data join concepts. By associating data with DOM elements and managing changes to that data, D3.js allows you to create visualizations that can handle large amounts of data without manual intervention. However, performance can become an issue with very large datasets, so it’s important to optimize your code and use techniques like data aggregation and filtering to reduce the amount of data being processed.
Can I use D3.js with other JavaScript libraries?
Yes, D3.js can be used with other JavaScript libraries. It’s designed to be flexible and modular, so you can use it alongside other libraries or frameworks like jQuery, React, or Angular. This allows you to leverage the strengths of each library and create more powerful, interactive web applications. However, keep in mind that integrating multiple libraries can add complexity to your code, so it’s important to have a good understanding of each library and how they interact.
 Kevin Kononenko
Kevin Kononenko is the founder of Manual, a site where developers have been voting on the most helpful coding and design tutorials on the planet. He is also a self-taught web developer.