Matt Magain’s recent blog post about constructing the new SitePoint Book Matrix raised a couple of interesting questions, which I’m going to try to answer, since it was me who built it.
When is a table not a table?
When its data isn’t really tabular; in other words, when the data it represents isn’t really two-dimensional. What we have here is visually two-dimensional, hence at first glance it might seem reasonable to represent it as tabular data; but the data itself isn’t really two-dimensional at all, it’s linear.
A two-dimensional data set has two axes, each representing a different range or set of values, so we should be able to plot axes against the data and be able to make meaningful cross-references. But as the illustration below shows, we can’t:
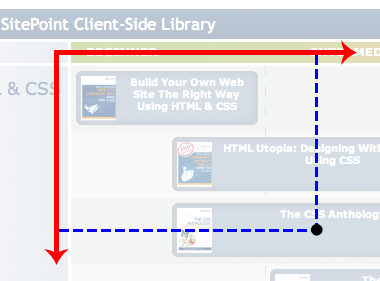
Sure we can plot those lines and create that reference point, but they don’t mean anything, because the x and y axes both represent the same scale (skill level).
Before we can implement the design we need to decide how the data should be marked up, and that’s why it’s so crucial to determine the inate structure of the data first, in order to know what kind of element semantics to use. And when considering semantics, the bottom line I always use is to think about how the data will be comprehended by those using a screenreader, in which there are no visual cues, only semantics.
Plotting that data in a table, it seemed immediately obvious to me that this was the wrong way of structuring it:
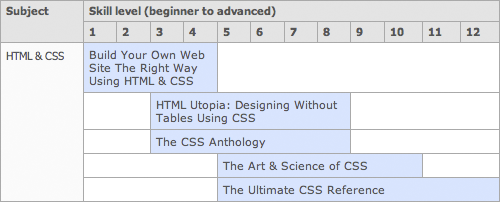
How coherent is the structure — do we gain a progression of data by traversing across the columns? Does the ordering of rows and columns mean something explicit such that a single point within the table can be cross-referenced? Or is it merely that the data happens to fall into columns because we’re still thinking of it visually? I think it’s the latter, and that presenting the data in this way would be innacurate and confusing.
So now lets represent that same data linearly:
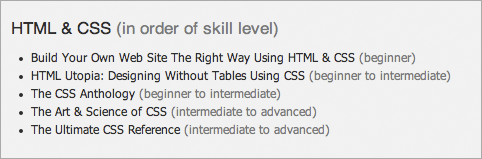
And immediately it seems far simpler and more coherent, and much much easier to understand, whether you’re looking at, it or hearing it read linearly.
The conclusion I came to then was that the data is a simple linear structure, and is only presented in a visually two-dimensional way because this makes it easier to see patterns at a glance.
Why is the CSS for this so hairy?
Well it isn’t particularly difficult or complicated, but neither is it desparately simple. The major difficulty with this, as with all precise layouts, is creating it so that it scales with font and window size. This requirement means that all sizes and positions must be relative, and all boxes must be flexible, so that the layout remains consistent and accurate regardless of the user’s settings:
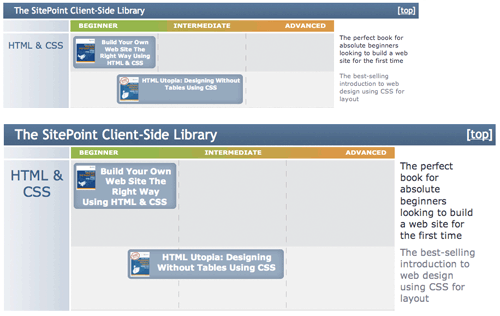
Another challenge that crept in is the fact that the colored scale across the top is of visual interest only — this information has no meaning when the content is linearised, therefore it needed to be created in a way that only impacts on the visual layout and isn’t present as content.
The explantory text down the right-hand side was similarly tricky to position. In terms of the markup, this content comes immediately after each book title; but visually it’s way off to the right. The CSS for this had not only to create this layout, but do so in a way that ensured solid flexibility — so that the both height of the book box and the height of the text would affect the overall item height co-dependently (ie. altering either of them affects them both).
Have a look at the stylesheet if you’d like to poke around.
And of course, the endless gradients and rounded-corners our trendy designer insists on using makes everything far more complicated … I guess I’m just a glass is twice as big as it needs to be
kinda guy!
 James Edwards
James is a freelance web developer based in the UK, specialising in JavaScript application development and building accessible websites. With more than a decade's professional experience, he is a published author, a frequent blogger and speaker, and an outspoken advocate of standards-based development.