This post was sponsored by Ptengine. Thank you for supporting the sponsors who make SitePoint possible!
A novel isn’t about the words; it’s about the story conveyed by the text. Similarly, website statistics provide substantial visitor data, but it’s more important to understand the user activities that lead to those figures.
For most of us, providing statistical usage reports is simply a matter of adding a Google Analytics script to every page. Site owners are presented with an overwhelming quantity of information and can quickly identify whether traffic is increasing or decreasing. But the data won’t tell them why.
It’s difficult to determine how visitors are interacting with the website, for example:
- Are people using that widget?
- Are users distracted by the color scheme?
- Are the images and videos helpful or annoying?
- How far do people read down the page?
- Is that call-to-action button being used?
The more you know, the more you want to know…
Google Analytics will provide an insight but it’s complex. Clients are often bamboozled by terms such as sessions, bounces, funnels and conversions and they need expert help. That expert requires a combination of technical development, statistical analysis and psychological profiling skills. Presuming they can find such a person, it’s a full-time job which costs more time and money than all but the largest corporations can afford.
Visitor Interaction Metrics
Fortunately, there are cost-effective solutions for digital marketers, UI designers and developers of online businesses of all sizes. Ptengine provides interaction metrics which reveal the stories behind the raw data. Features include:
Simple Implementation
There’s no need to add code for custom events, downloads, conversions or sales — a single script activates all the features.
User-Friendly Reports
Simple reports offer one-click filtering, page grouping, campaign analytics and a breakdown of devices, browsers, geographical locations, conversions and events. Today’s traffic can be compared with the average to determine whether campaigns are effective or not.

Time-on-Page Metrics
Ptengine accurately determines how long the user remains on a page regardless of whether they click through to another page.
Click Tracking
Click tracking is more sophisticated than basic link tracking. Users may click items which are not links such as tabs, widgets, form elements, etc. Importantly, they may click an item thinking it’s a link…
Multi-Device Heatmaps
Finally, the killer feature. Heatmaps indicate where visitors focus their attention, scroll and click on each page.

Unlike other heatmap solutions, Ptengine:
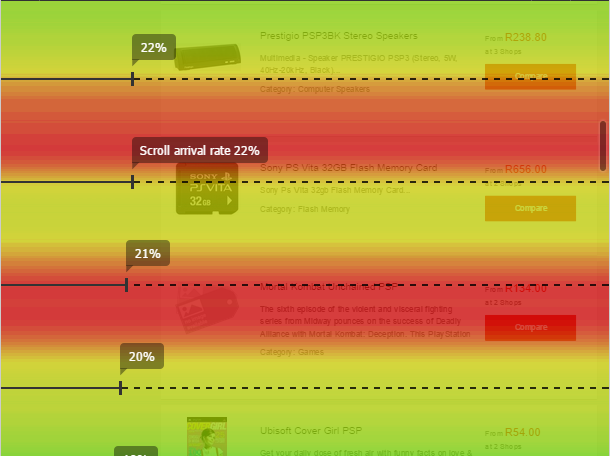
- Provides attention maps which highlight the certain areas that gain more visitor attentions by hotter color belts, and scroll arrival maps which highlight the proportion of users who scroll to a point in the page:
- Is device-aware and caters for Responsive Web Designs. For example, you may be able to determine that mobile users are scrolling to content which is ignored by desktop users and modify your design accordingly.
- Allows pages to be filtered and compared which makes it ideal for A/B testing.
Ptengine offers a free plan with all the features included. Every free plan starts with a full feature package for 30 days and commercial plans are available based on your page views and the features you require.
How Can You Use Ptengine to Improve Conversion
Let’s consider some typical use-cases.
Example One
Your home page has a high bounce rate. Google Analytics will tell you this but it won’t reveal why.
You suspect the large carousel banner could be to blame. However, the designers think it’s great — they have space to express their artistic integrity! The marketing department thinks it’s fantastic — they can implement numerous marketing campaigns on the same page. Your client loves it — they have a huge dynamically updating area which looks cool.
Ptengine can prove who’s right. It’s impartial and won’t succumb to stakeholder biases or prior opinions:
- The reports indicate that 97% of users spend less than twenty seconds on the home page. However, the carousel rotates every thirty seconds — the vast majority of visitors never see more than one campaign. So why implement further banners?
- The attention map shows only 8% of people scroll past the carousel to reach the primary call-to-action buttons. In particular, those on smaller mobile devices think the banner area marks the end of the page and so don’t scroll further.
- The click map highlights that fewer than 1% of visitors click carousel links. It looks like a banner advert, the buttons aren’t prominent and they lead to areas of the site which rarely convert to sales (“about us”, “news”, etc).
Perhaps it’s time to reconsider the design and focus on what’s really important?
Example Two
Your sales have fallen despite an increase in visitors. Again, Google Analytics and your sales reports will show this trend but understanding why it’s happened is not clear.
Looking at the primary shopping pages, you discover an increase in the number of goal-irrelevant elements such as coupons, social networking widgets, and comments. The click heatmap proves these have strong call-to-action messages and buttons that distract buyers and drive them away from the products to less important areas of the site.
The solution: Simplify the pages and have fewer interruptions during the journey. If there are any doubts, you can split visitors into two groups — one is shown the current design, the other is show a basic product-only view. Using heatmaps for each A/B experiment is a great method to quickly understand visitor behavior. Within a few days it’ll be possible to determine which design has been the most effective at sales conversions. The content and design can then be updated as necessary.
Website Wisdom
Raw data from website statistics provides a wealth of information but that alone is not enough. With website wisdom, you can apply reasoning to that knowledge and make suitable judgments and decisions which has a positive impact on website traffic, conversions and sales.
Ptengine may be your first step on the road to enlightenment!
Giveaway
Ptengine has an exclusive offer to SitePoint readers, giving those who complete the following steps a three-month full-featured package. To claim your own, share this post on Twitter and mention ‘@ptengine’. Then sign up to Ptengine, email contact@ptengine.com with a link to your tweet, and wait for them to do the rest. They’ll be in touch within 24 hours during the work week. It’s an easy way to give Ptengine a go!
 Craig Buckler
Craig is a freelance UK web consultant who built his first page for IE2.0 in 1995. Since that time he's been advocating standards, accessibility, and best-practice HTML5 techniques. He's created enterprise specifications, websites and online applications for companies and organisations including the UK Parliament, the European Parliament, the Department of Energy & Climate Change, Microsoft, and more. He's written more than 1,000 articles for SitePoint and you can find him @craigbuckler.